WordPress and Google Analytics are two BI tools (Business Intelligence) that go together like peas and carrots (if you're into that sort of thing). WordPress powers over 35% of websites today and Google Analytics is running on over over 53% of websites, so it’s pretty reasonable to believe you’ve probably met someone who runs a website that uses both. Who knows, maybe that person is you!
These two web mainstays power everything from my silly coding blog to TechCrunch, so of course we want to analyze WordPress and Google Analytics data together! For this tutorial, we will use Panoply because—as a data warehouse with built-in ETL for MySQL and Google Analytics—it’s made for this. We’ll also use Metabase to visualize the data.
WordPress data structures
As mentioned in an earlier post about MySQL as a data warehouse, WordPress apps stores most data relevant to its users’ publications in a MySQL database. So let’s take a minute to look at how WordPress structures your data in their backend.
If you take a look at the WordPress documentation, you’ll see there are quite a few tables made for each WordPress instance, but we’re not going to go over all of them in detail. The main tables we’ll be concerned with in our WordPress MySQL database are:
- `wp_users`: A collection of data about the users you have authorized to work on your WordPress account. Username, hashed password, etc.
- `wp_posts`: Data about the posts themselves - author, title, content, as well as a lot of other bits and pieces
- `wp_terms`: A table containing categorical information about posts, links and tags associated with posts
- `wp_comments`: A table containing information about the comments attached to individual posts
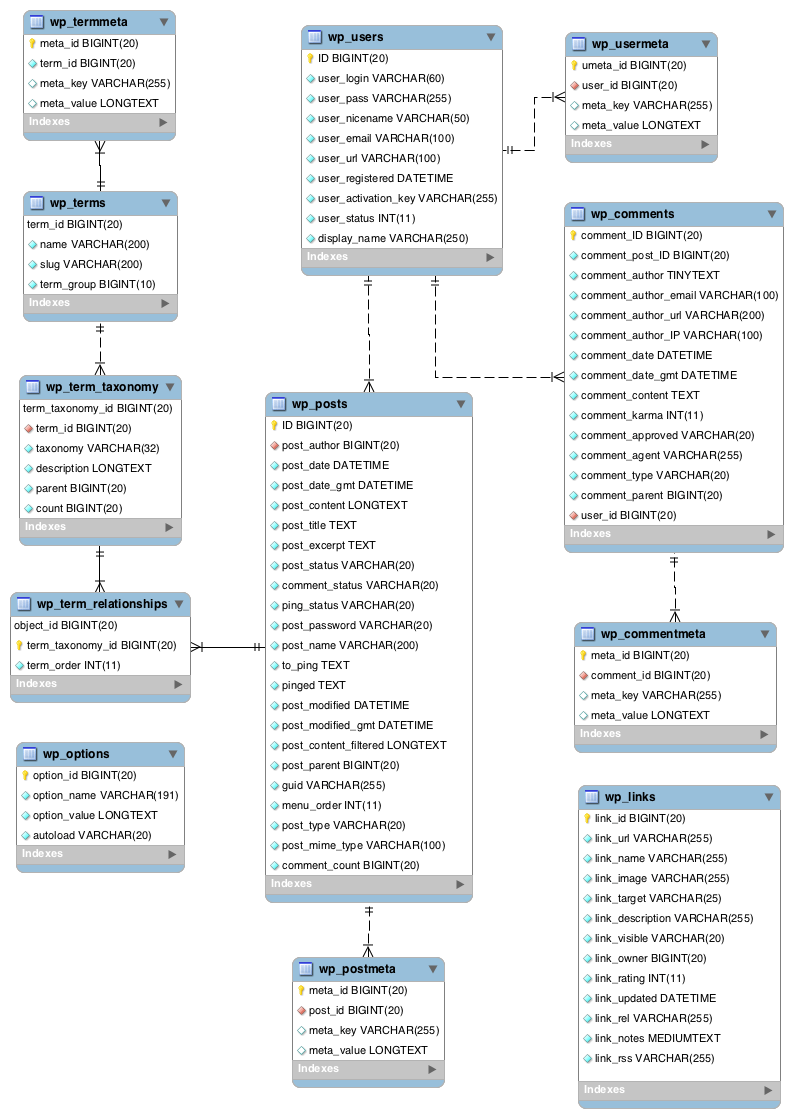
But just so you have a good sense of the overall structure of the database—and how the tables relate to each other—it will probably be helpful to look over this ER diagram as well:
Integrating your MySQL data with Google Analytics data
Before we get into the data itself, first we have to collect it all in one place. For the purposes of this demo, that place is Panoply. The nice thing about Panoply is that it is a powerful data warehouse with ETL built right in. So to get these two data sources together, we just have to log in to Panoply and set up your MySQL and Google Analytics data sources.
Collecting MySQL Data
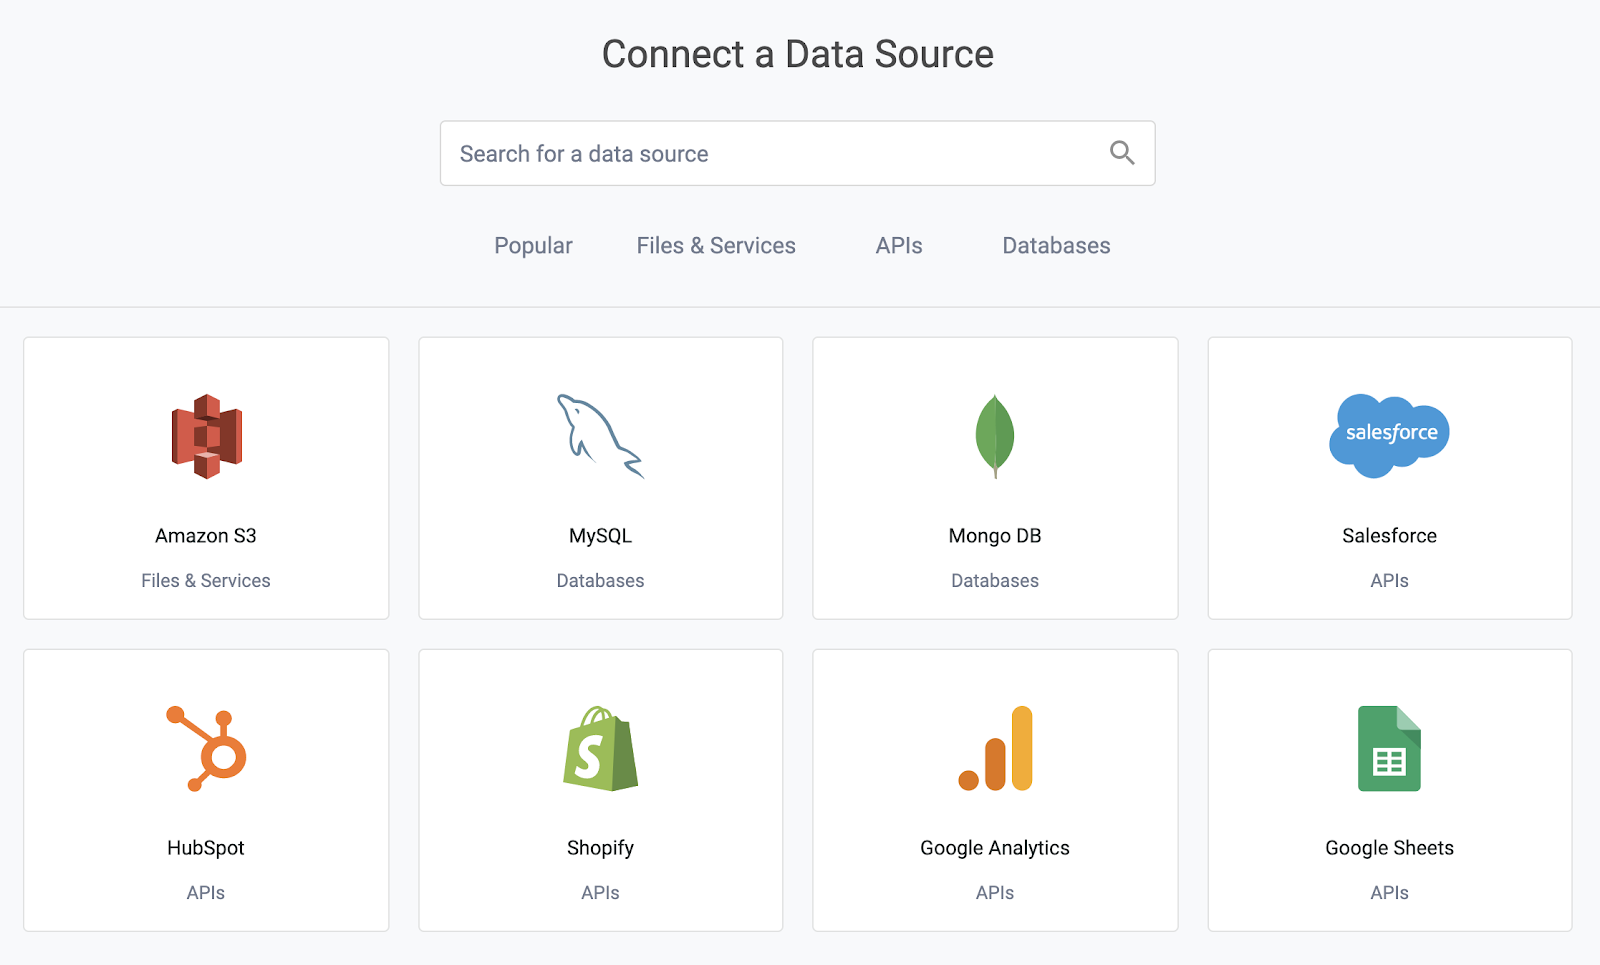
First search for the MySQL data connector. Once you create a new MySQL data source, you’ll need your MySQL connection details. Those can be found towards the beginning of your wp_config.php file and they’ll be set in the code that looks like this:
    /** The name of the database for WordPress */

    define('DB_NAME', 'database_name_here');

    /** MySQL database username */

    define('DB_USER', 'username_here');

    /** MySQL database password */

    define('DB_PASSWORD', 'password_here');

    /** MySQL hostname */

    define('DB_HOST', 'localhost');
* Of course, the database host is the domain of your WordPress website rather than localhost.
Panoply will automatically prefix all the WordPress tables upon ingestion with `wordpress_` so your `wp_posts` table will be named `wordpress_wp_posts`. But if you want to change the prefix, you can set the prefix in the “Destination” field of the advanced options. You can learn more about the MySQL data connector in the Panoply MySQL docs.
Collecting Google Analytics Data
The Google Analytics data connector is also quite simple, and luckily even a bit easier. Once you’ve searched for and created a new Google Analytics data source, all you have to do is use your Google account that is tied to your Google Analytics account to see what data is available.
You can now choose your Google Analytics account, and the metrics and dimensions you want to analyze with your WordPress posts. Note that the Google Analytics API sets “a performance baseline by allowing a maximum of 7 dimensions and 10 metrics in any one API request” but at least that’s a whole lot more than you can get from the Google Analytics app interface!
For the purposes of this demonstration, I chose the following metrics and dimensions:
Metrics: ga:entrances, ga:pageviews, ga:bounces, ga:timeOnPage
Dimensions: ga:hostname, ga:pagePath, ga:dateHourMinute, ga:deviceCategory
This means we are going to get metrics associated with every page, segmented by device category, by every minute of the day. That’s really granular! But it’s also pretty overkill in most cases since each dimension will drastically increase the amount of data you’re storing in Panoply.
You could also modify or remove all of them except for ga:pagePath, because we need those values when it comes to joining the Google Analytics data to the WordPress data. You can learn more about the Google Analytics data connector in the Panoply Google Analytics docs.
I named my table `wordpress_google_analytics` in the destination field. Clearly, I’m no Bill Shakespeare when it comes to table names…
Setting up for analysis
Ok, not so fast. If you thought we’d get right into writing analytical queries and surfacing novel insights about our WordPress site, you have to realize that WordPress databases are structured so that they can quickly serve data about one post at a time rather than all the data about all the posts in a way that is better for analysis.
To understand more about this, check out our post on databases vs data warehouses. Panoply is a data warehouse that is optimized for analytical querying—specifically for ELT which is the process of transforming data into new tables after it is in the data warehouse.
Let’s look at how we would query the WordPress tables to get one clean table for analysis.
SELECT
  posts.id,
  posts.post_name,
  posts.post_title,
  users.id author_id,
  users.display_name author_display_name,
  posts.post_type,
  posts.post_status,
  posts.post_parent,
  posts.comment_status,
  posts.comment_count,
  posts.post_date_gmt,
  posts.post_modified_gmt,
  posts.guid
FROM
  wordpress_wp_posts posts
  JOIN wordpress_wp_users users ON posts.post_author = users.id
WHERE
  post_type IN ('page', 'post', 'forum', 'topic')
  AND post_status = 'publish'
This query joins the `wp_posts` table to the `wp_users` table so that we can see posts’ authors in columns alongside details about the posts they authored including how many comments it has, when it was posted, and when it was modified. It also filters out posts that aren’t published yet or are of other weird types.
This provides a result set that looks like this:
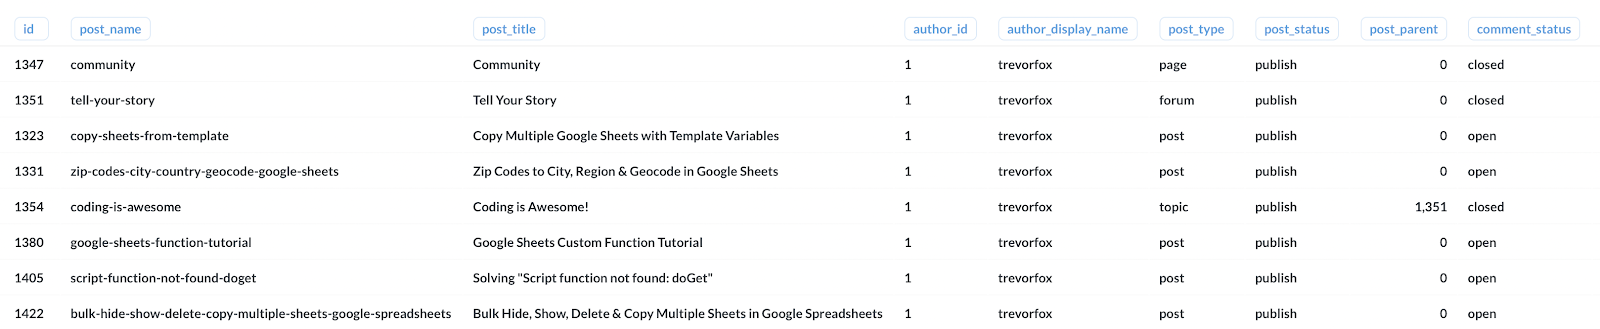 (Some columns are not shown so that the image would fit)
Creating an analytical view
Now, since we don't want to re-use that whole mess of a query every time we ask questions about our WordPress posts, let’s create a view. This will essentially allow us to save this query as a named reference, which will allow us to pull data from this table more easily and do analysis that way.
So how do we create a view? It’s pretty simple, actually. We basically just add `CREATE VIEW tablename AS` at the top of the above query, and then we can easily reference it later. Here’s what that actually looks like in practice. We’re going to call our view `wordpress_posts`:
`wordpress_posts`: A concise view of published WordPress posts and their authors
CREATE VIEW wordpress_posts AS (
  SELECT
    posts.id,
    posts.post_name,
    posts.post_title,
    users.id author_id,
    users.display_name author_display_name,
    posts.post_type,
    posts.post_status,
    posts.post_parent,
    posts.comment_status,
    posts.comment_count,
    posts.post_date_gmt,
    posts.post_modified_gmt,
    posts.guid
  FROM
wordpress_wp_posts posts
    JOIN wordpress_wp_users users ON posts.post_author = users.id
  WHERE
    post_type IN ('page', 'post', 'forum', 'topic')
    AND post_status = 'publish'
);
Now, to get the same result set as above, all we have to do is run this simple query:
SELECT *
FROM wordpress_posts;
See, views are pretty great! This is a whole lot better than that mess of an ERD diagram above.
Query: How are our authors’ posts performing?
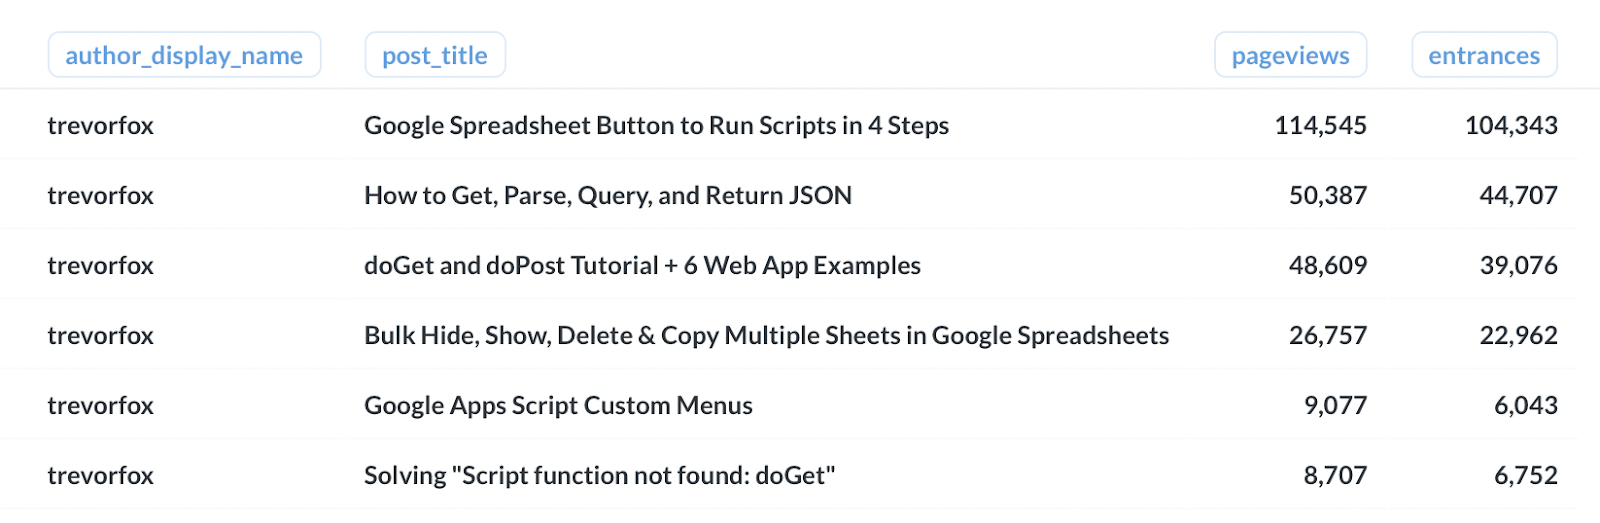
Now that we’ve got our view all set up, we can start to ask actual questions about the data. So let’s revisit the questions we laid out above. “How are individual authors’ posts performing” is definitely something we can answer with our `wordpress_posts` view. So let’s generate a breakdown of performance, in terms of total pageviews, for each author in our WordPress backend:
SELECT
  wpp.author_display_name,
  wpp.post_title,
  SUM(wpga.pageviews) pageviews,
  SUM(wpga.entrances) entrances
FROM
  wordpress_posts wpp
 JOIN wordpress_google_analytics wpga ON wpga.pagepath ILIKE '%'||wpp.post_name||'%'
GROUP BY 1, 2
ORDER BY 3 desc;
Most of this makes sense, but you might be wondering what is happening on this line:
JOIN wordpress_google_analytics wpga ON wpga.pagepath ILIKE '%'||wpp.post_name||'%'
Instead of joining on a column that has exactly matching values, we’re using the LIKE operator to find rows in the 'wordpress_google_analytics' table where the page path is a substring of the post URL that is stored in the 'wordpress_posts' table. It’s not perfect and it could be cleaned up further (because data is messy!) but it works pretty well because the “U” in URL stands for Unique, so we can be confident we’re joining on the right URLs.
The results from that query will look like this:
Query: Which author gets the most traffic?
If you’ve ever read Trust Me, I’m Lying, you know that, for many online publications, authors are incentivized by the number of pageviews (and corresponding ad revenue) that they generate. That’s a little extreme but maybe you want to have a fun challenge for your company blog.
This query will give you a traffic (pageview) leaderboard for the last 28 days.
SELECT
  wpp.author_display_name,
  SUM(wpga / pageviews)
FROM
  wordpress_posts wpp
 JOIN wordpress_google_analytics wpga ON wpga.pagepath ILIKE '%'||wpp.post_name||'%'
WHERE
  wpga.datehourminute > current_date - 28
GROUP BY 1
ORDER BY 2 desc;
This will give you results that look like this (pretty boring if your blog only has one author):

Yay, I’m winning!!
Query: How fast does traffic grow for each post?
With Google Analytics it’s impossible to compare growth rates of all the different pages on your site because well, time is relative. You see traffic grow cumulatively but you can’t compare posts by their age. This query uses the datediff function to calculate the post age, so we can compare traffic to each post by their age in weeks.
SELECT
  author_display_name,
  wpp.post_title,
  DATEDIFF('day', wpp.post_date_gmt :: date, datehourminute :: date) weeks_live,
  SUM(pageviews) total_pageviews
FROM
  wordpress_posts wpp
 JOIN wordpress_google_analytics wpga ON wpga.pagepath ILIKE '%'||wpp.post_name||'%'
WHERE weeks_live > 0
GROUP BY 1, 2, 3
ORDER BY 3 DESC;
That will return results that looks like this:
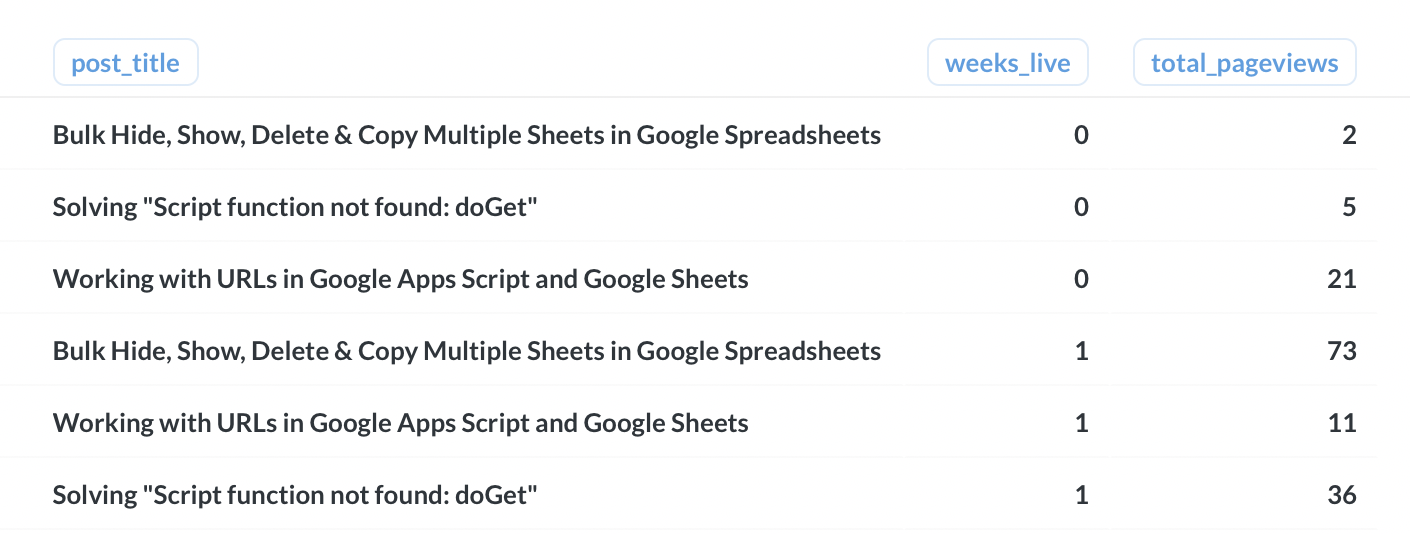
Which will make a graph that looks like this.
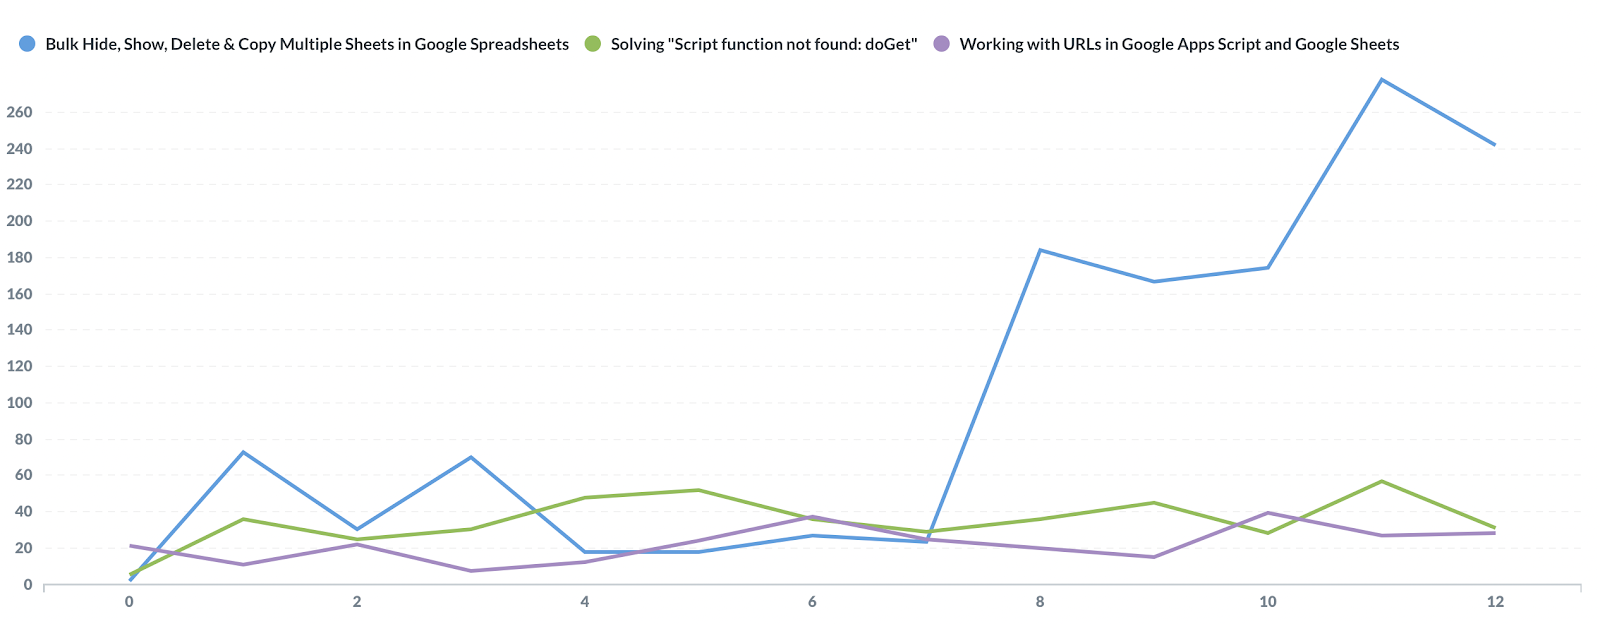
Clearly something happened for one of these posts (#growthacking) after the 7th week because, unlike the others, it took off!
Wrapping up
As you can probably see, there’s a lot you can do here, even when just working from the view we created at the outset. The best part, though, is that this little tutorial is applicable to any situation where you might find yourself needing to analyze MySQL data alongside other data sources in a data warehouse. We happen to think that Panoply is a great way to do this sort of thing quickly and easily, but you can use this tutorial on any platform. If you’re curious about other things you could analyze with Metabase, check out the Metabase integrations.


