For years, Microsoft has been a leader in Gartner's quadrant for intelligence and analytics platforms. In other words: it has a complete vision and can execute it.
While Microsoft offers an extensive suite of business intelligence solutions, SSIS (SQL Server Integration Services), SSAS (SQL Server Analytical Services), and SSRS (SQL Server Reporting Services) are the traditional strongholds of its BI stack.
That's a whole mouthful, indeed!
All these tools serve use cases related to intelligence, analytics, and reporting in one way or another.
One of the latest tools in the Microsoft BI family is Power BI. Building on the corporate successes of the existing BI Suite, Power BI has become one of the most popular data visualization tools on the market.
The keys to Power BI's success
- Power BI is easy to use. Business users should have no problem exploring and drilling down in their dashboards. On the other hand, Power BI is also highly versatile and can handle complex transformations and calculations.
- Power BI feels very familiar. With a very recognizable interface, it should be within the comfort zone of those who are hooked to their Excel spreadsheets. Advanced users will be pleased that data ingestion and manipulation are done with the same tools as in Excel: Power Query and DAX.
- Power BI has clever integrations with Microsoft Flow and Power Apps. It also seamlessly connects with data sources within the Microsoft (Azure) ecosystem such as SQL Server, Data Lake, HDInsight, and Synapse.
More importantly, Microsoft hasn't created a walled garden for its business intelligence solution. Hundreds of connectors for data sources—direct competitors of Microsoft products—are available out of the box.
Exploring data from Google BigQuery, Amazon Redshift, or SAP Hana with Power BI is only a couple of clicks away.
That being said, connecting to semi-structured (NoSQL) data sources like MongoDB, Cassandra, and DynamoDB is less convenient.
Is Microsoft to blame for this? Not at all. When you think of NoSQL, you don't immediately think of business intelligence.
Non-relational databases (i.e., NoSQL) are ideally suited for operational purposes because of their scalability, flexibility, write speed, and fast response time for simple queries. A typical key-value store performs speedy lookups when you give it a key, but it's not optimized for analytical queries that require subsetting and aggregation.
Yet, as a data professional, you often have to defy these unwritten rules to get the automated insights you're looking for
Visualizing DynamoDB data in Power BI
In this article, I will discuss 2 options to visualize data from an Amazon DynamoDB database using Power BI.
- The easy way: an ELT data pipeline between DynamoDB and Power BI
- The hard way: install an ODBC driver on your local machine to connect to DynamoDB
For demonstration, I have set up a DynamoDB table with a sample data set called "Movies."
Option 1: The ELT data pipeline (aka, the easy way)
There are multiple reasons why an ELT workflow is particularly convenient for turning semi-structured data into insights.
First off, flattening a complex NoSQL database can produce dozens, hundreds, or even thousands of tables. Loading these tables and modeling them into Power BI is definitely an option, but it can be overwhelming and quickly deteriorate the speed of a dashboard.
In an ELT workflow, the workhorse will be the query engine of a data lake or warehouse, meaning the resulting tables will be optimized for producing the necessary insights within PowerBI.
Furthermore, the data inside NoSQL databases doesn't have a schema-on-write—it tends to evolve with the needs of the organization.
It's hard to imagine that visualization tools like Power BI can adequately handle that kind of flexibility, but ELT workflows are particularly suited to handle it. Analytics engineers can set up dbt (and even plain SQL) to be highly fault-tolerant. And if or when things do break, all data remains in the sink, where an updated transformation step can pick it up.
The power of Panoply
In the following example, I've set up an ELT workflow in Panoply to demonstrate the easy way we just discussed.
Panoply is well-suited for this because it packs all the tools you need to bring data from a DynamoDB table to Power BI. These include:
- Tons of connectors that bring data from SaaS tools and databases to the data sink.
- A SQL workbench to transform the extracted data into an analysis-ready table.
- An underlying data warehouse, for which Power BI has an out-of-the-box connector.
It does, however, come with one requirement: you need to have the proper user rights to create an AWS user with the appropriate policy, specifically AmazonDynamoDBFullAccess or AmazonDynamoDBReadOnlyAccess.
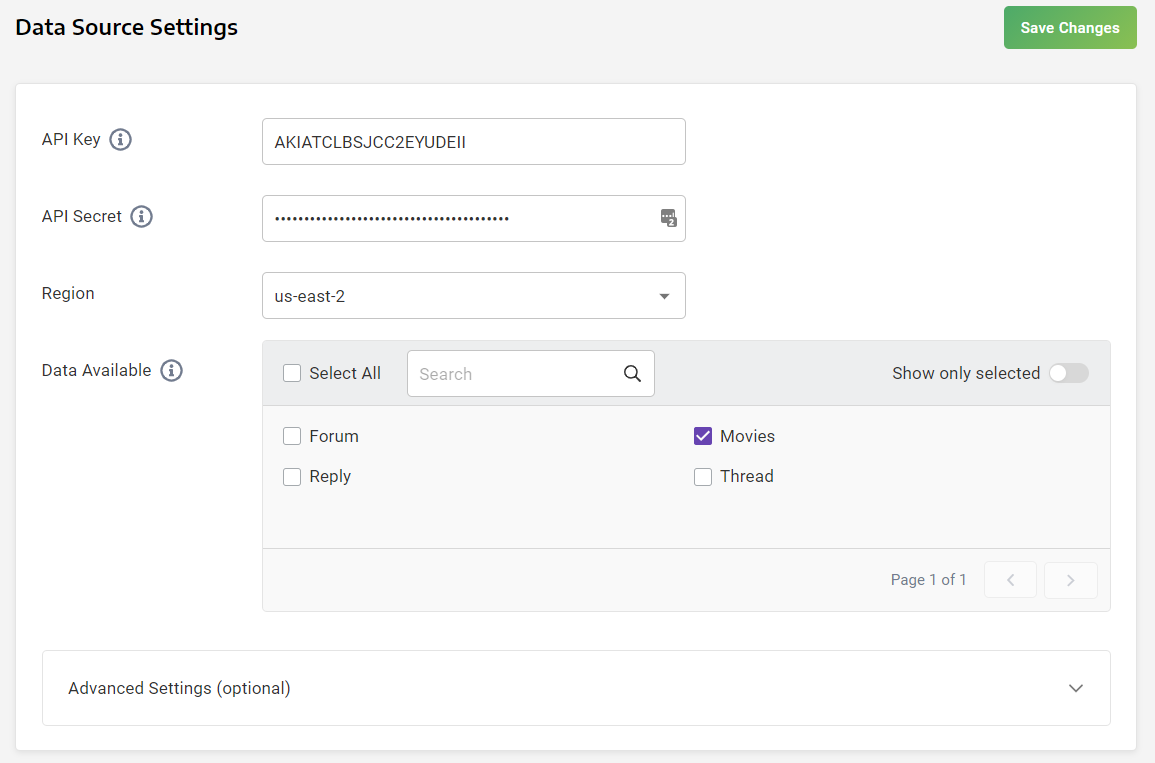
Within Panoply, connecting to DynamoDB can be done by inputting the provided API Key, API secret, and the region in the "Data Source Settings."
Once the connection has been established, you can select the tables you'd like to extract.
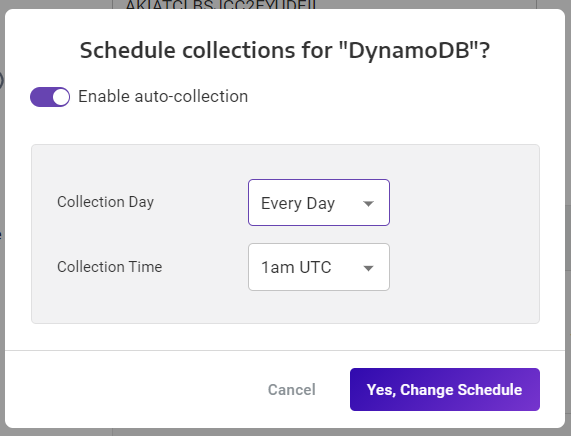
You can schedule this job to run automatically and both incremental loads and complete loads are supported.
Once the data is loaded, we can see that the Movies table has three levels. The movie level has a title and info level. Within the info level you can find actors, directors, and genres.
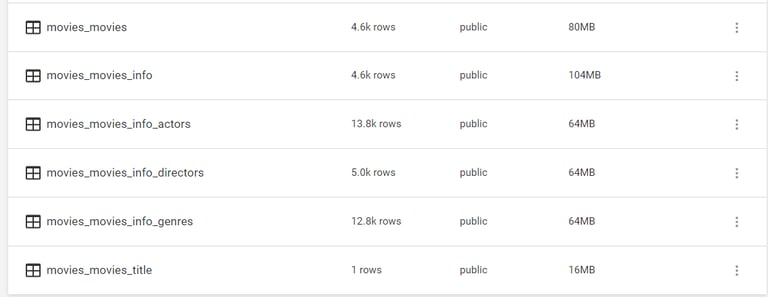
The info subtable of our Movies data breaks into three additional tables: movies_movies_info_actors, movies_movies_info_directors, and movies_movies_info_genres.
You now have 2 ways to proceed:
- You can load, model, and transform these tables directly in Power BI.
- Or, you can prepare an analysis-ready table inside Panoply and serve it to Power BI.
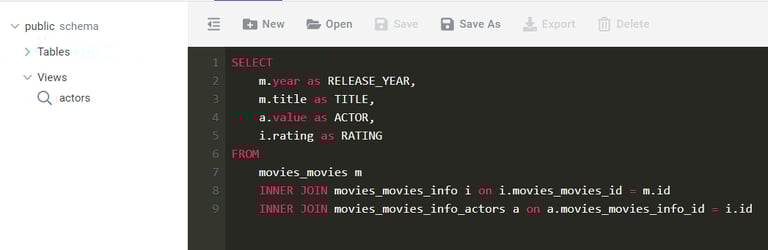
In line with my earlier remarks, you’ll want Panoply to be the workhorse of the required transformations. Inside Panoply’s workbench, you can write a query that brings the unnested tables together and save it as a single view.
Finally, go to the BI Connection tab in Panoply.
The following steps are done entirely in Power BI:
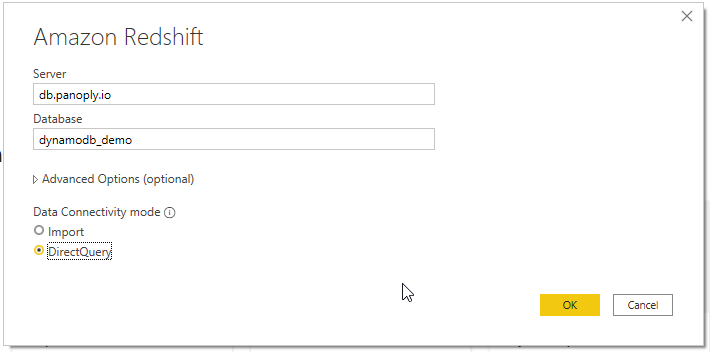
- Use Get Data and select Amazon Redshift.
- Insert the server and database name.
- Choose DirectQuery; There’s no need to import the data.
If all goes well, you’ll be asked to provide your username and password and select the tables you’d like to connect to.
You can now use the data source inside Power BI.
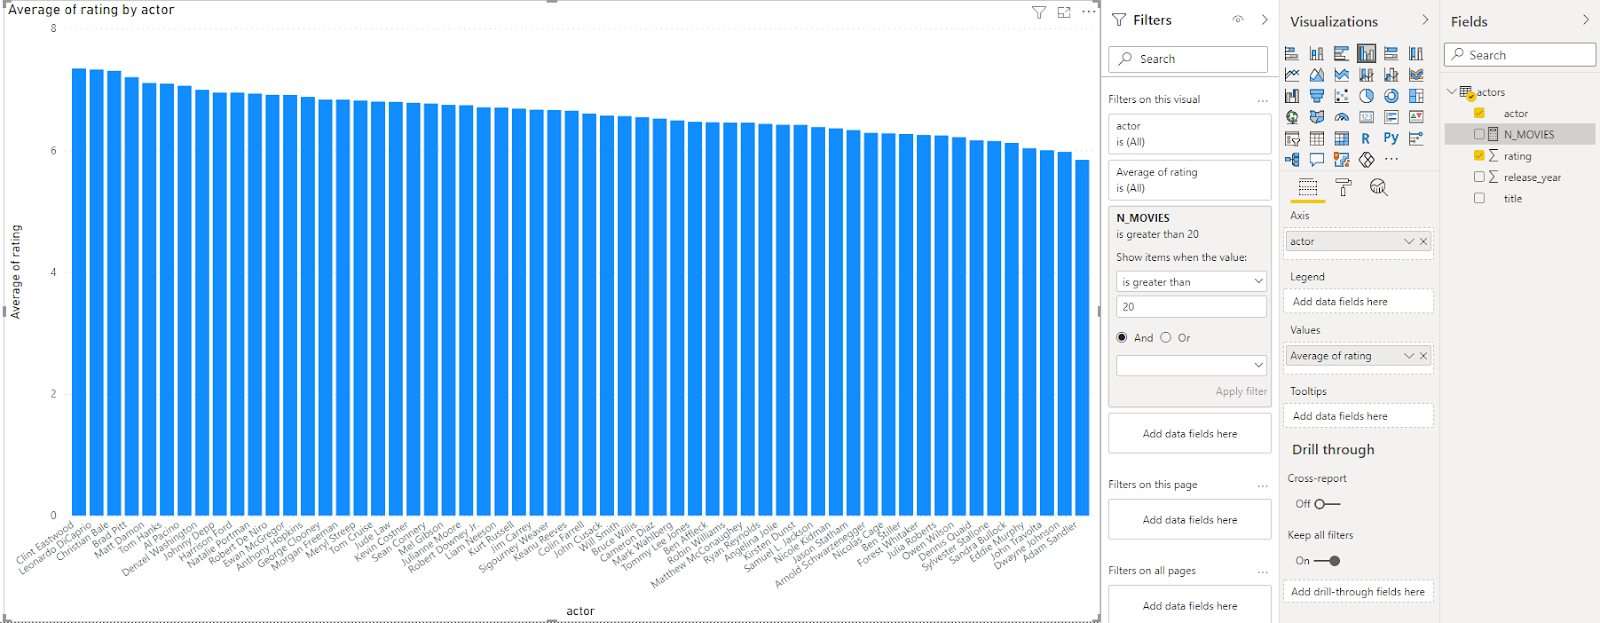
In the screenshot below, I used my data stored in Panoply to visualize the average rating for all actors that starred in over twenty movies.
Option 2: The ODBC connector
Connecting to DynamoDB can also be achieved via an ODBC driver.
An ODBC (Open Database Connectivity) driver is the translation layer between a source system (DynamoDB) and an application (Power BI) and uses SQL as the standard for accessing the data.
Multiple vendors sell licenses for their DynamoDB ODBC drivers.
These drivers come with minor differences, but the one thing they have in common is that they flatten the NoSQL database and turn it into a tabular format.
A popular choice to consider is the Simba DynamoDB ODBC connector, which is accessible for all via the trial version.
Installing it and using it within Power BI comes with some requirements:
- You need to be able to assign policies to users in Amazon Web Services
- You need administrator privileges on your machine to install the ODBC driver
Now, let's get started!
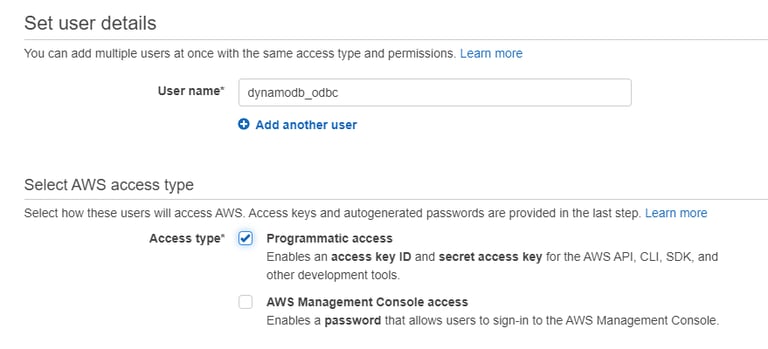
Your first step is to create a user with the AmazonDynamoDBFullAccess or AmazonDynamoDBReadOnlyAccess policy in AWS.
Next, download a trial version of the Simba DynamoDB ODBC Driver. Make sure you provide your actual email address because it will be used to send you the temporary license.
Once you have installed the driver, open the email that you should have received from Simba Technologies. Follow the email’s instructions to put the attached file in the appropriate folder.
Configure the driver in the following way:
- Go to your start menu (Windows) and perform a search for ODBC Admin.
- Click on the 64-bit version.
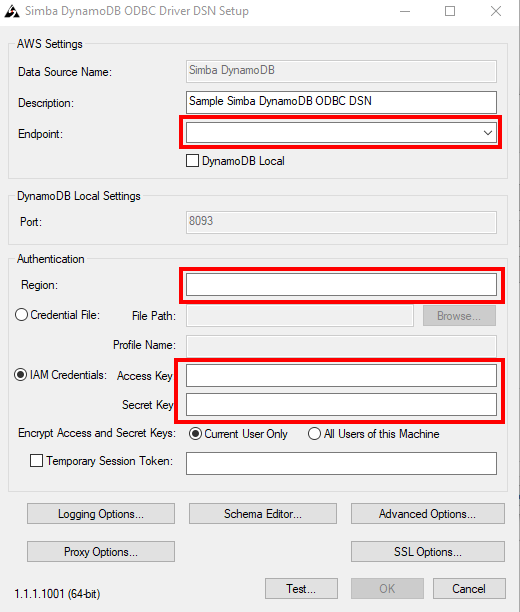
- Click on the System DSN tab and select the Simba DynamoDB driver and click on Configure.
- Add your endpoint (and region).
- Add the Access Key & Secret Key from the AWS user you created.
Now, we can move over to Power BI.
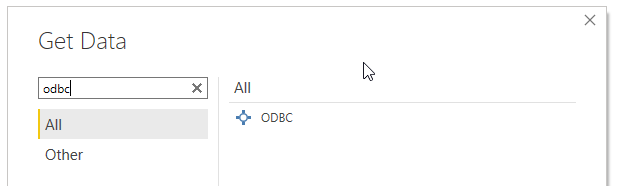
Once there, click Get Data and search for ODBC, then double click it.
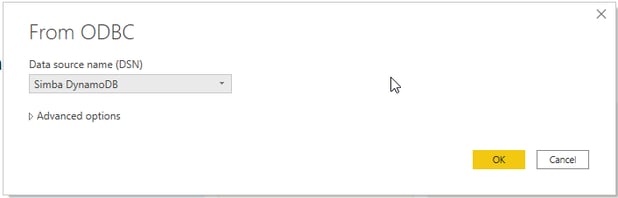
In the next window, you will select the Simba DynamoDB from the "Data source name (DSN)" dropdown.
If everything went well, you should now be able to use the Power BI Navigator to explore all the DynamoDB tables.
As you can see below, the ODBC driver has flattened the semi-structured objects and has created new tables for all nested objects.
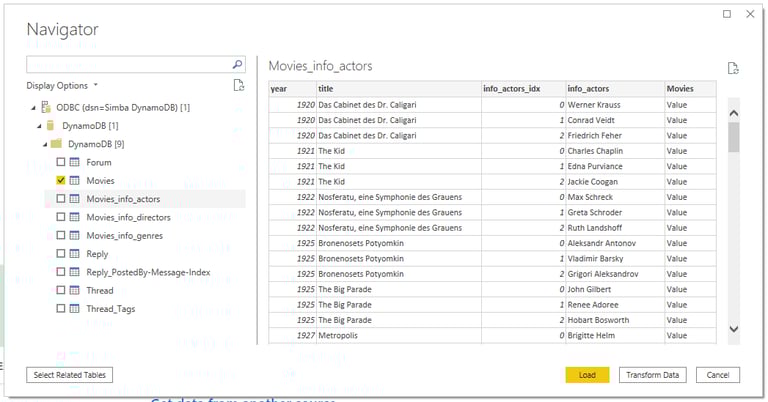
Just like with any other data source, you can now transform and model the data.
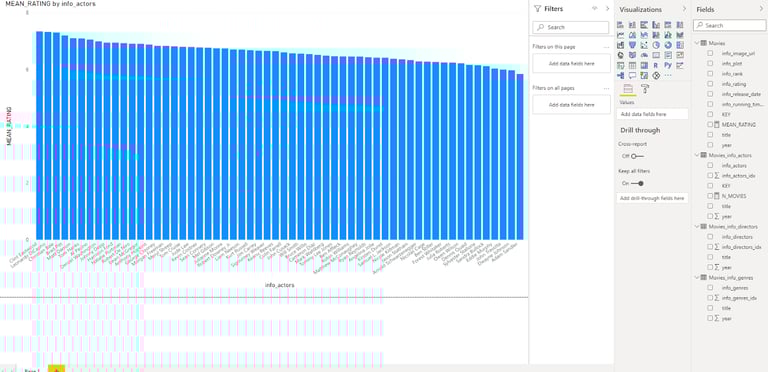
In the example below, I created a visualization from two tables that I modeled joined via a 1:n relationship. It shows the average rating for each actor with more than twenty roles.
Wrapping Up
Bringing data from DynamoDB to Power BI is a fantastic way for you and your team to be able to visualize all of your project’s information, but it can be a fairly daunting task if you’re not adequately prepared.
While you can manually use an ODBC connector, using Panoply to create an ETL pipeline is a much smarter way to get data into Power BI because it enables easier querying and faster loading of your dashboards.
Follow the simple steps above and you’ll have DynamoDB up and running in no time!


