Google Ads is all about efficiency. The formula for success is simple: target the right audience with the right ads at the right price. The better you do at each of those things, the more cost-efficient and successful you’ll be.
There is a well defined art and science to scaling Google Ads accounts effectively and you can dedicate your whole life to perfecting the practice or... if you just want to get a quick answer to reducing your cost per conversion, cost per acquisition, or cost per whatever, this post is for you. This post will demonstrate a 10 minute analysis that could save you hundreds per month on car insurance ad spend.What are negative keywords?
You probably already know, but in case you don’t, negative keywords can help advertisers better target their ads by ensuring that Google will not display your ads for searches for the negatively-targeted terms
By appearing less frequently for irrelevant searches, you will pay less frequently for clicks that are unlikely to lead to revenue for your business. As a result, you’ll waste less ad spend and have more ad spend to apply toward high ROI searches.
Let’s be honest, Google is not completely concerned with your ROI. They are apt to show your ads more frequently than you’d like because it increases their cost-per-click revenues. In other words, Google wants you to use as much ad budget as possible even if it’s really just a waste for you.
Yes, they do provide some limited visibility into common terms that are triggering your ads within the Google Ads Overview dashboard but it is far from comprehensive.

The limitation of Google’s report is that there are no metrics associated with the search term. We can do better!
When you finish this analysis, you will end up with a big list of keywords that you can add to your By adding them to your negative keyword list, Google will prevent your ads from being shown when people perform searches that contain your negative keywords.
Sound fun? Let’s get started.
The hard thing about keyword targeting
It is amazing that Google search works at all. Searchers can, and do, assemble some crazy search terms. And it’s very common that a single word can vastly change a user’s search intent. Let’s take two search queries that we might see in Panoply’s Google Ads data.
data warehouse tool
There’s a good chance this is somebody doing software research (maybe looking to buy).
ralph kimball data warehouse toolkit
This is somebody looking for a book with a specific title.
Both keywords are somewhat similar; they both contain the phrase “data warehouse tool”. From Panoply’s perspective, we want people to learn about Panoply if they are searching for a “data warehouse tool” but not for a seven year old book!
From a Google Ads targeting standpoint, there are instances when you might want to be targeting the first term but end up targeting the second, quite irrelevant and budget-wasting search term.
Luckily, there is a solution. Target the main phrase, but exclude searches that contain “kimball” or if you want to be really picky, exclude searches that match “ralph kimball data warehouse toolkit”.
Now... how do we identify negative search terms at scale?
Search query analysis isn’t easy
Search data is really noisy! Search queries with the same intent can have different ordering. This means as the search phrase gets longer, the word ordering can have all kinds of permutations and the number of permutations get out of hand quickly!
So how do we find signal in the noise?
We can’t just look at the exact search queries. The high volume queries will generally make sense and the irrelevant queries are so infrequent that we would have to comb through the entire long tail of < 5 impression queries to find them. And even if we did find them, how would we know if they are worth adding to our negative keyword list?
It’s time to aggregate! But this is no ordinary SQL aggregation. We are going to aggregate our search metrics by individual words within a search query. Let’s get to it.
Connecting to the Google Ads API
This might sound like a big deal but it’s not.
- Log into Panoply
- Follow the Panoply’s Google Ads documentation to connect Google Ads data integration
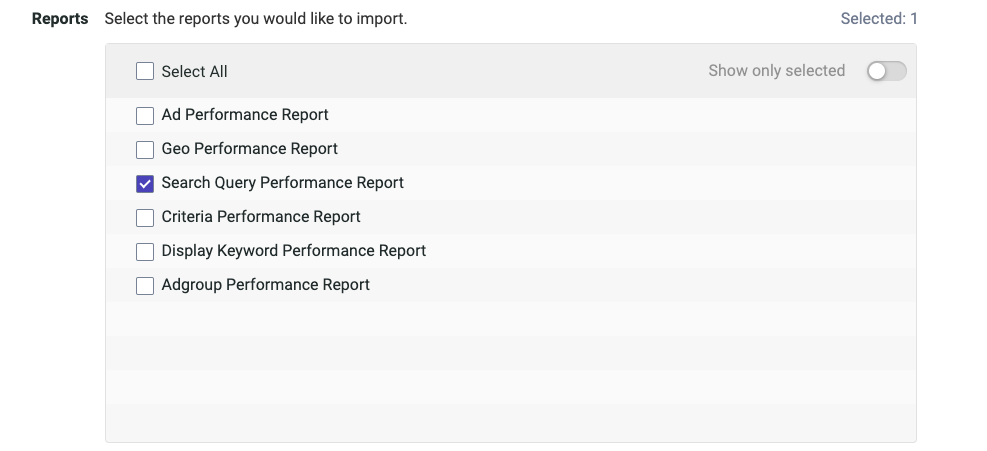
- Sync the Search Query Performance Report into Panoply. Don’t worry about the advanced configurations, there is nothing to do there.
Once you’ve collected the data into Panoply you can do to the Tables screen to view your data. You’ll see a table called adwords_search_query_performance_report. That is the only table you’ll need for this analysis.
Aggregating search metrics by query tokens
First, let’s cover some terminology. You already know that a “query” is the full phrase that the searcher sends to Google. A “token” is an individual element of a query; it could be a word, number, individual letter, or just some nonsense. “Search metrics” are metrics like impressions, clicks, and the cost associated with each click.
Briefly skipping to the end...
In the end, we’re going to have a table of tokens and aggregate metrics that looks like this:
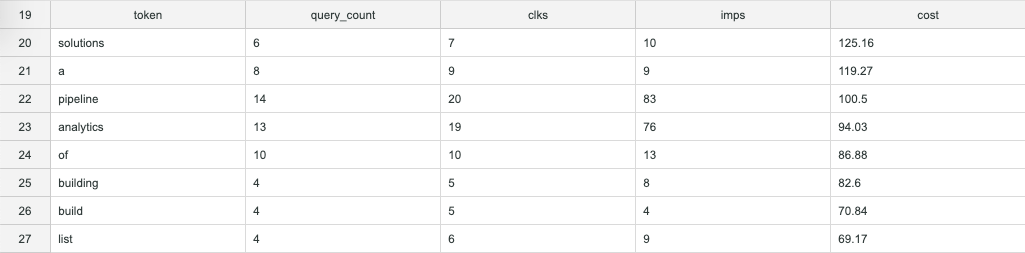
This table will list each token that appears in the entire collection of our past search queries. That makes it easier to spot negative keywords. But we’ll get to that later...
Tokenizing search queries
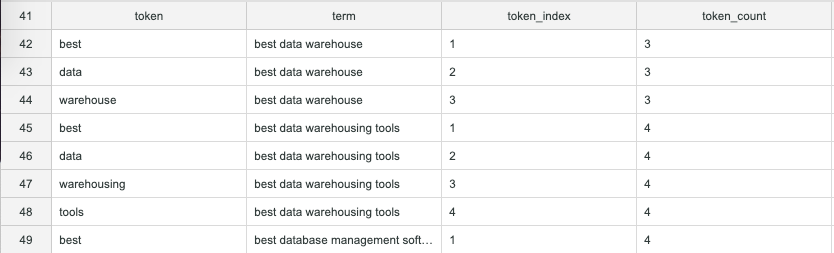
In order to get to our table of tokens, we need a table that contains our whole “vocabulary” like this. The table looks pretty simple but really, this is where the magic happens.
In order to build this vocabulary we need to do the following:
- Find the word count for each query in our collection. We do this by using a common table expression (CTE) called “grouped_query_token_count“
- Generate an arbitrary table of integers. This is another CTE called “series”
- Join these two CTEs together into another CTE in a way that creates a column of individual tokens and another column of corresponding search queries. This CTE is called “vocabulary”
Part three is seriously where the magic happens and I have to give credit to my colleague, Gal for this one. Let’s look at the query so far:
WITH grouped_query_token_count AS (
  SELECT sq."search term" term,
    regexp_count(sq."search term", ' ') + 1 token_count
  FROM adwords_search_query_performance_report sq
  WHERE sq.day >= '2020-01-01'
  GROUP BY 1, 2
  ),
series AS (
  SELECT row_number() OVER () token_index
  FROM adwords_search_query_performance_report
  ),
vocabulary AS (
  SELECT DISTINCT split_part(gt.term, ' ', s.token_index::INT) token,
    gt.term,
    s.token_index,
    gt.token_count
  FROM grouped_query_token_count gt
  JOIN series s ON gt.token_count >= s.token_index
  WHERE token NOT IN ('', ' ')
  )
SELECT *
FROM vocabulary
ORDER BY 2,3
The JOIN clause is very unusual but it suits our purposes perfectly. If the query could talk it would say, “Join the two tables where the token number in the series is less than the number of tokens in the query.” This means each search query will have one row for the number of tokens that it has with a token_index column containing an integer, starting at 1, for each line.
That, on its own, isn’t really interesting. It’s how the token_index is used that creates the magic.
The token_index column is passed to the split_part function to determine which “part” of the string should be extracted. As a result, you get each token on it’s own row with its corresponding search query. Yep, that is some SQL magic!
Putting it all together
From here, the rest is easy. We just have to join our search metrics back to our tokens table (vocabulary) and group by the tokens to aggregate the search metrics.
Here is the complete query:
WITH grouped_query_token_count
AS (
  SELECT sq."search term" term,
    regexp_count(sq."search term", ' ') + 1 token_count
  FROM adwords_search_query_performance_report sq
  WHERE sq.day >= '2020-01-01'
  GROUP BY 1,2
  ),
series
AS (
  SELECT row_number() OVER () token_index
  FROM adwords_search_query_performance_report
  ),
vocabulary
AS (
  SELECT DISTINCT split_part(gt.term, ' ', s.token_index::INT) token,
    gt.term,
    s.token_index,
    gt.token_count
  FROM grouped_query_token_count gt
  JOIN series s ON gt.token_count >= s.token_index
  WHERE token NOT IN ('', ' ')
  )
SELECT regexp_replace(v.token, '[^a-zA-Z0-9 ]', '') token,
  count(DISTINCT sq."search term") query_count,
  sum(sq.clicks) clks,
  sum(sq.impressions) imps,
  round(sum(sq.cost)::FLOAT / 1000000, 2) cost,
  sum(sq."total conv. value") value,
  round(clks::FLOAT / imps, 3) ctr
FROM vocabulary v
JOIN adwords_search_query_performance_report sq ON v.term = sq."search term"
WHERE impressions > 0 AND sq.day >= '2020-01-01'
GROUP BY token
ORDER BY 5 DESC;
As a result, we have a list of search tokens ordered by cost from highest to lowest. The query_count column denotes how many unique search queries contained each token. Finally, we have a nice, clear signal!
One last thing to bear in mind: adding the cost column up will not provide an accurate total cost for your Google Ads search campaigns because the cost associated with each token is a summed cost of all the search queries that it belongs to.
Now that you have a sense for what keywords you want to inspect further, you can run this query to get metrics for all the search queries that contain that specific token.
SELECT '{the token you want to inspect goes here}' AS token,
	sq."search term",
	sum(sq.clicks),
	sum(sq.impressions),
	sum(sq."total conv. value")
FROM adwords_search_query_performance_report sq
WHERE sq."search term" ilike token || '%' OR sq."search term" ilike '% ' || token || ' %' OR sq."search term" ilike '% ' || token
GROUP BY 1,2
ORDER BY 4 DESC;
Following the example above when I replace the "{the token you want to inspect goes here}" with "kimball", I get a list of mostly irrelevant keywords that include: kimball kimball data modelling, kimball kimball data warehouse, kimball ralph kimball data warehouse toolkit, and kimball ralph kimball.
Looking deeper, you can decide if the keyword itself should be added as a negative keyword or just some of the particular phrases.
Generating you negative keywords list
The criteria for a negative keyword is pretty simple. The goal is to avoid displaying ads and paying for clicks on irrelevant searches, so you’re looking for high cost, low relevance keywords. I like to go down the list from high cost to low cost and judge each keyword based on its topical relevance to the product or service. For a first pass, this works pretty well. And if you’ve never done it before, you’ll probably find several hundred dollars of monthly cost savings with this method.
A more data-driven method is to add another column to the table like so:
sum(sq."total conv. value") conv_value
Assuming you have conversion tracking set up in your Google Ads account, that will sum the conversion value that followed clicks to queries that contained a given token. This works especially well for ecommerce accounts with lots of transactions. It may not work so well if, like Panoply, you are a SaaS business with relatively less frequent sales.
Setting up your negative keywords lists
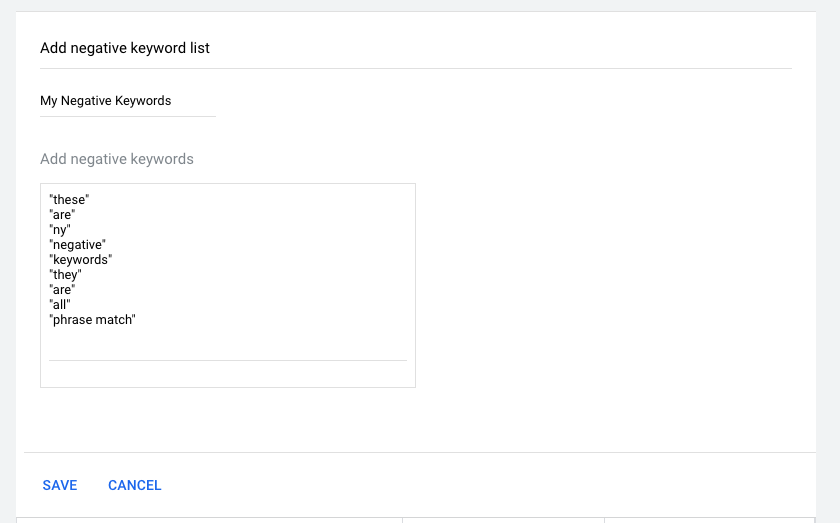
Now that our keyword analysis is complete and you’ve picked out your budget-wasting keywords, head over to the negative keyword list builder in your Google Ads account: https://ads.google.com/aw/negativekeywordlist.
From there, it’s as simple as clicking the big blue + icon to create a new negative keyword list, populating your lists, and applying that lists to the appropriate search campaigns.
Want to go even farther?
First, go ask your boss for a $200/month raise.

After that, there are a few other things you can explore with this general idea. You can also do the same kind of search query analysis with Panoply’s Bing Ads API integrations or Google Search Console API integration. You can also apply this analysis to Wordpress comments or Zendesk ticket text.
To take the next steps, we have a Wordpress analysis tutorial and digital ads dashboard tutorial too!


