Earlier this year we partnered with Square to tackle a common problem: how can Square sellers unlock more robust reporting, without hiring a full data team? While we already had a Square connector in the Panoply platform, we took this opportunity to expand on our offering to provide Square sellers with an end-to-end solution from raw data to business insights.
Now with Panoply, Square users can ingest their data into a managed data warehouse, query it with pre-built data recipes, and then present that data in a business ready dashboard, all in just a few clicks. And the best part? No data engineers, advanced SQL queries, or other complicated code is required.

This is a great opportunity for business users who may not know how to run SQL analysis, but want to get their data into useful dashboards that they can use for making data-driven decisions. It’s also a great starting point for analysts tasked with business reporting, who are unsure of what reports to start with.
Whatever your use case, the process is simple, and we’ll walk you through it now.

1. Sign up for a Panoply Proof of Value
If you don’t already have a Panoply account, go ahead and start there. With our new 60 day proof of value, you have plenty of time to see how the platform will work for you.
2. Connect your Square account
On the ‘Add Data Source’ tab, search for and select Square. Next you’ll login to your account and follow Square’s authentication process. For more detailed information and advanced settings, check out our Square documentation.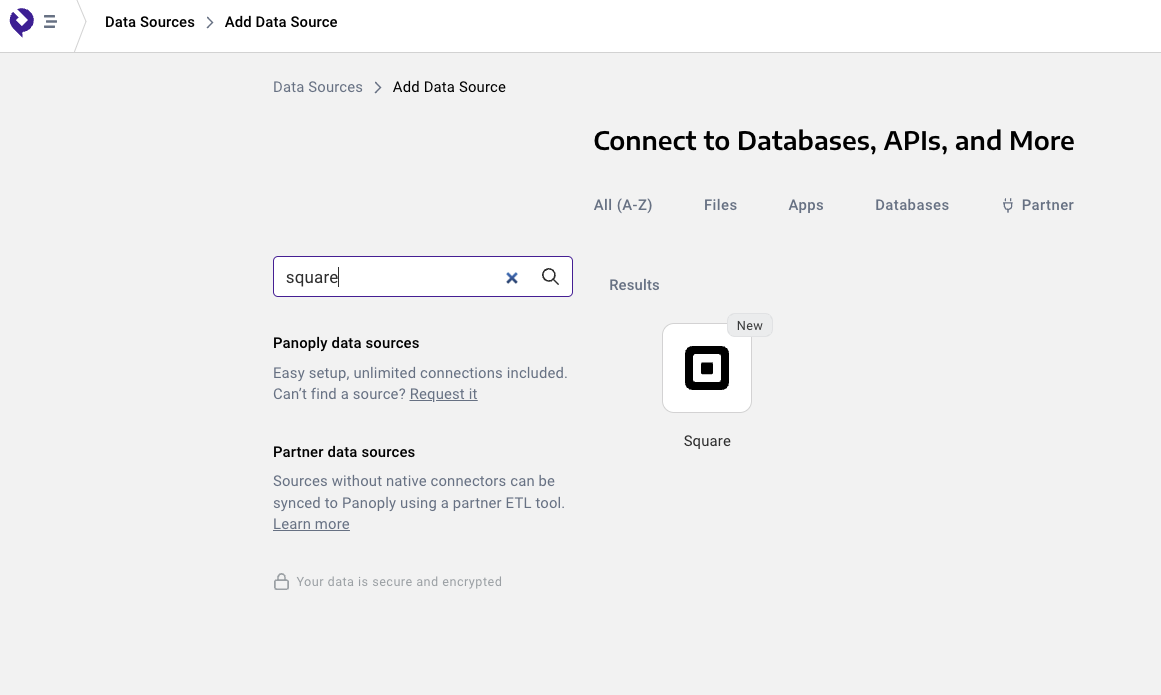
3. Collect Data
There is a variety of data available within the Square data source (check out our Square data dictionary here), and you can select which fields you want to bring into your warehouse. Keep in mind, there are certain fields that you’ll need to include in order to use data recipes or dashboards.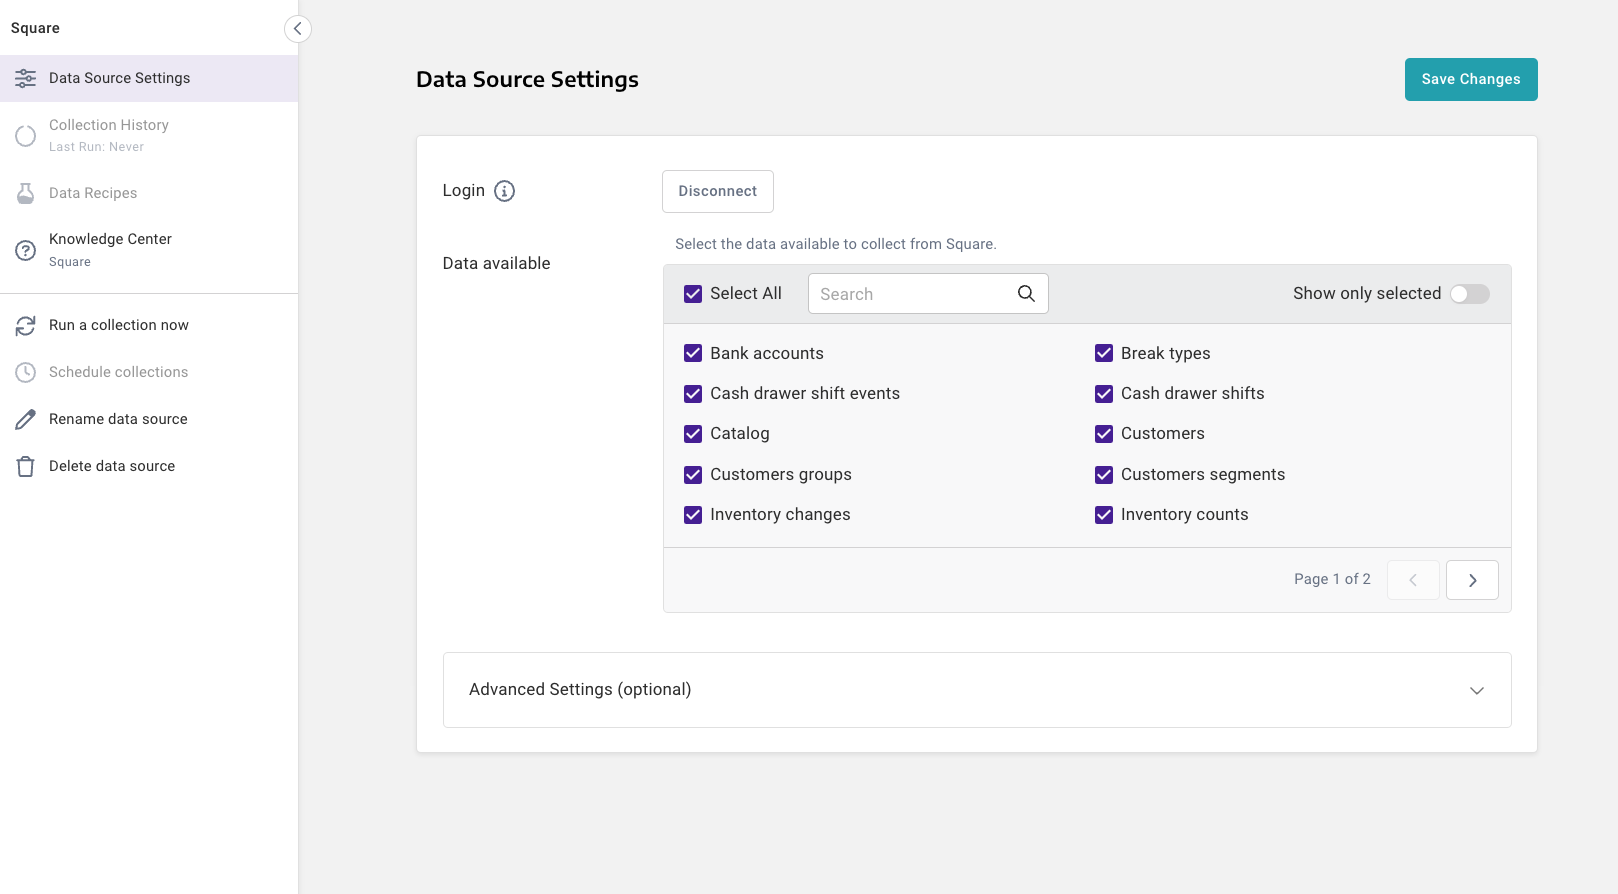
4. Launch the dashboard
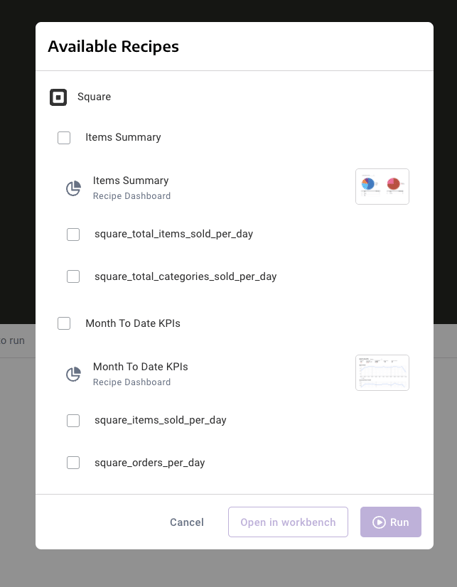
Once your data is collected, you can go straight to available data recipes. These recipes, which are outlined below, are the building blocks for our prebuilt dashboard. At this step, you can run or edit an individual recipe, or you can go straight into the Google Data Studio dashboard.
We used Google Data Studio here for a couple of reasons. First, it’s a free tool, so anyone can use it to get started with dashboards. Second, since our platform is built on Google BigQuery, users will already have a google account that was created when they launched their data warehouse, so the setup is seamless. If you’re already using a different business intelligence tool, feel free to use this dashboard as inspiration for building something similar in your own tool.
5. Update with your data
Since we don’t have access to our users data connections, the dashboard that launches here is a template, built from the data recipe queries and sample data. To use it, make a copy of the dashboard, connect your own data following the on-screen instructions, and you’ll be up and running with your own live dashboards!
.png?width=606&height=360&name=image%20(35).png)
Doing custom analysis on your Square data
While our prebuilt queries and dashboards are a great starting point for anyone looking to get started with data analysis—or go beyond what’s available in Square native analytics—they certainly won’t be able to answer all of your business questions straight out of the box. After all, every business has different reporting needs, and our goal was to cover the most common use cases.
For users who are more comfortable with SQL and want to customize their reporting beyond what is provided in the platform, there’s an option for you too.
On the screen with available data recipes, you can pick a single recipe, and select ‘Open’ instead of ‘Run’. This will open the SQL query in our workbench, so you can see how the recipe is built, and make any changes you might want. Once you’ve edited the query, run or save it as you would any other query. This is a great option for users who are familiar with SQL, but might not want to write queries from scratch.
Of course, you also have the option to skip data recipes all together, and go straight into the Panoply workbench to write your own queries from scratch. In this way, you can use our data recipes as a starting point to get to the data you need, or as just one part of your overall analysis approach. 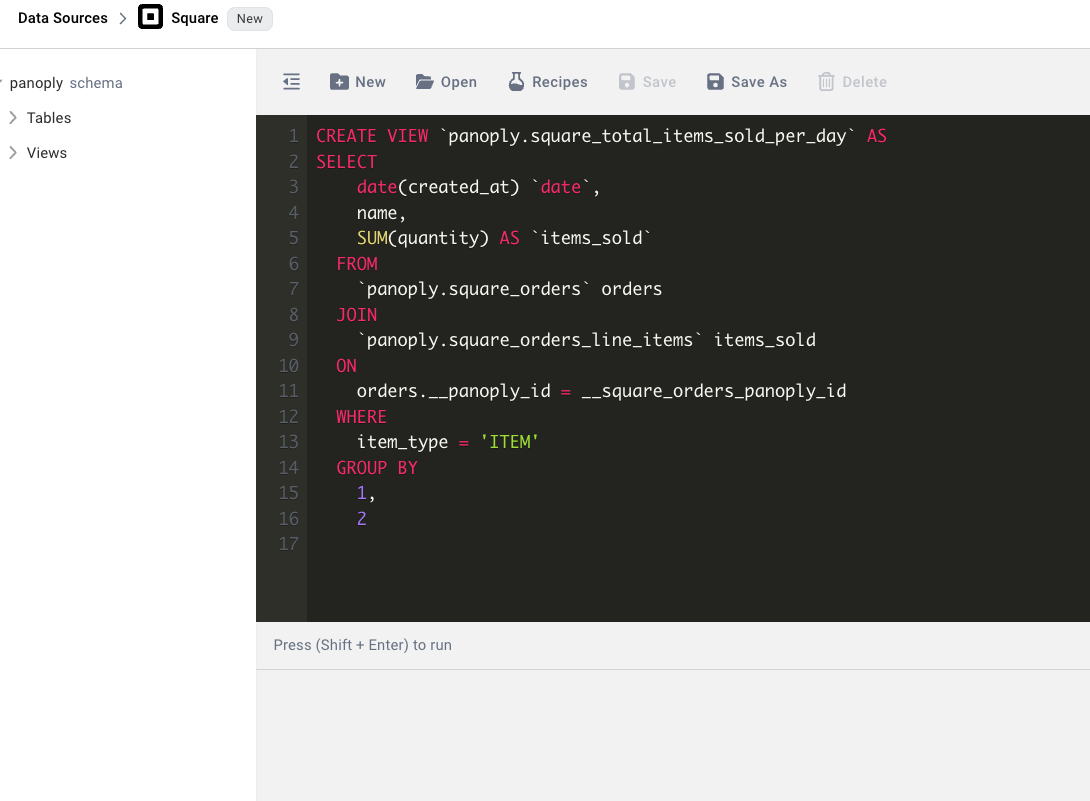
Data Recipes
While this will be an ever-growing list, as of launch day we have two recipes available for your use. Each recipe includes multiple views that will be saved to your data warehouse, and a dashboard template that will build a visualization for each view.
- Items Summary
- Includes the following views:
- square_total_items_sold_per_day
- square_total_categories_sold_per_day
- Includes the following views:
- Month to Date KPIs
- Includes the following views:
- square_items_sold_per_day
- square_orders_per_day
- square_top_items_this month
- square_top_categories_this_month
- square_returning_customers_this_month
- square_total_customers_this_month
- square_revenue_and_refunds_per_day
- Includes the following views:
These should be a great starting point for you to dive into deeper insights with your Square data!
Going beyond Square data
Our hope is that gaining deeper insights into your Square data is just the first step on your data journey. Sure, looking at revenue by month or location is important, but imagine how much more powerful your data will be when you incorporate multiple data sources.
The real power of Panoply lies in bringing together data from multiple sources, be it Square, your CRM, an advertising platform, accounting software, or more, and creating a single source of truth for your data within your data warehouse. No more copying data from different sources into a spreadsheet, running pivot tables and vlookups. With all of your data in one place, you can run more sophisticated data analysis, and glean important business insights that might have otherwise gone overlooked.
If you’re curious about learning more, book a personalized demo today.


