Why Your Shopify Data Needs a Warehouse
A data warehouse is a place to store data solely for the purpose of analysis. That may not seem that interesting—and it isn’t—but its the capabilities that a data warehouse offers for optimizing your ecommerce business that makes things interesting. Here are just a few of these capabilities:
- A single-source-of-truth for all your business. This means you don’t have to worry about block-box app integrations or web analytics tool implementations just to get a trustworthy view of your data. Your Shopify data is imported (ETL’ed) in its raw form so there is no need to worry about missing or corrupted data.
- Integrate all your ecommerce data. Not only do you get a clean copy of all your Shopify data, you get a clean copy of all your data. Even better: the data is in a place where you can merge and analyze it together. You can integrate your Google Analytics data with your Shopify data to see how much ad spend leads to sales—directly, without any hand-waving correlations. Integrating your application data, your CRM data, and your marketing automation data is just as easy.
- Custom Analytics. Shopify dashboards only take you so far. What happens when you want advanced Shopify analytics to ask a question like, “what is the customer LTV segmented by the first product they purchased?” That’s impossible to answer in a Shopify dashboard. The questions you can ask are unlimited—so is the insight.
- Connect all your tools. Think about it, the analytical dashboards that Shopify offers to you are the same as the ones they offer to thousands of other customers. Why should you assume that you want the same reports in the same way? That’s where a BI tool comes in. A data warehouse provides a single source whether you're using BI Tools like Tableau or PowerBI, or analytical tools R Studio and Jupyter notebooks.
Want to see how easy it is to started with Shopify business intelligence? Well, you’re in the right place. This guide will take you from “I have a growing Shopify store and a ton of questions,” to “I have the ecommerce super fuel called “data” and I’m ready to use it.”
This guide will show you how to use Panoply to collect your Shopify data, what the Shopify API data looks like in Panoply’s easy-to-analyze tables, and how to explore your Shopify data in Panoply. Finally, you’ll learn how to connect a BI tool (Power BI) to Panoply for in-depth analysis and visualization. Let’s go!
Collecting Shopify Data Into Your Panoply Data Warehouse
Let’s follow the steps below and pull data from your Shopify store in your Panoply data warehouse.
Step 1. Click on Data Sources on your Panoply dashboard in the left upper pane.

Step 2. Click on Add Data Source in the upper right corner.

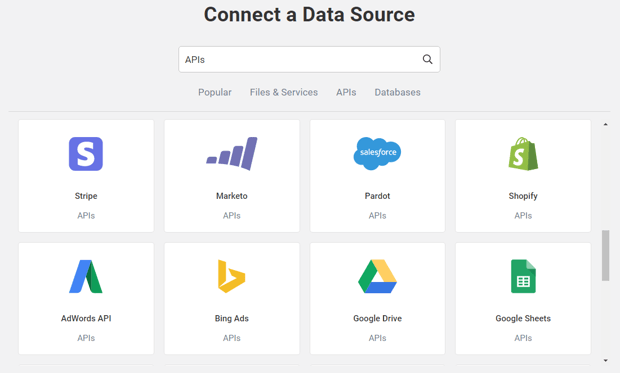
Step 3. Search for “Shopify” or browse the APIs category and click on the Shopify icon.
Step 4. Enter your shop name and click on Login. In the example below, the URL of the store is https://artgallery.myshopify.com, so the shop name in this case would be artgallery.
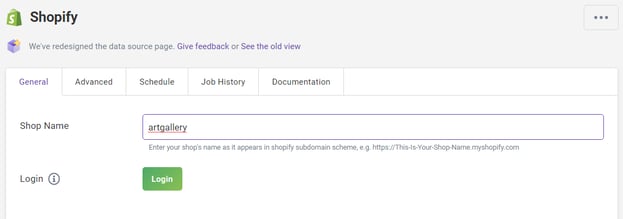
If this is your first time adding Shopify to Panoply, you’ll have to provide credentials to access the store. Otherwise, the system will recognize the store and connect automatically.
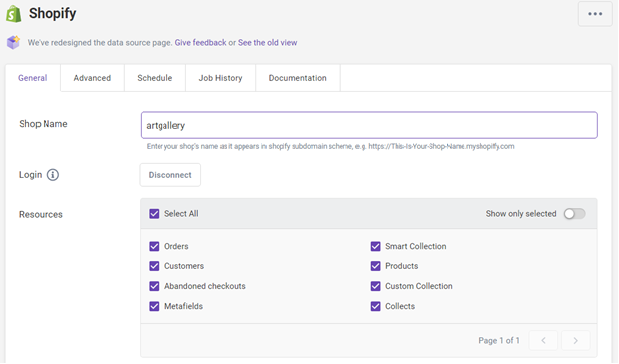
Step 5. Select the data you want to pull into Panoply:
- If you want to select all resources, click on Select All.
- If you want to select only particular resources, click on the checkbox next to the resource.
Step 6. You can set your advanced options preferences by clicking on Advanced tab. The Advanced Settings section allows you to set the following properties:
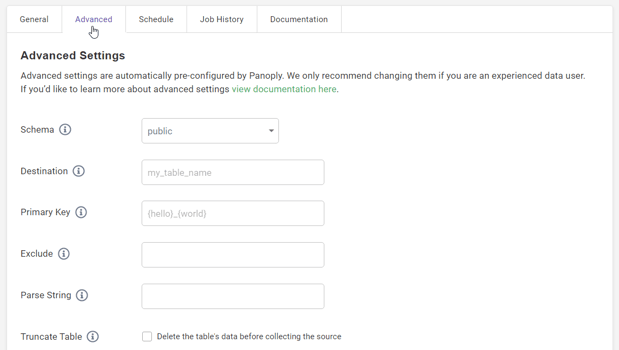
For additional instructions on how to set these options, see the Advanced Options documentation.
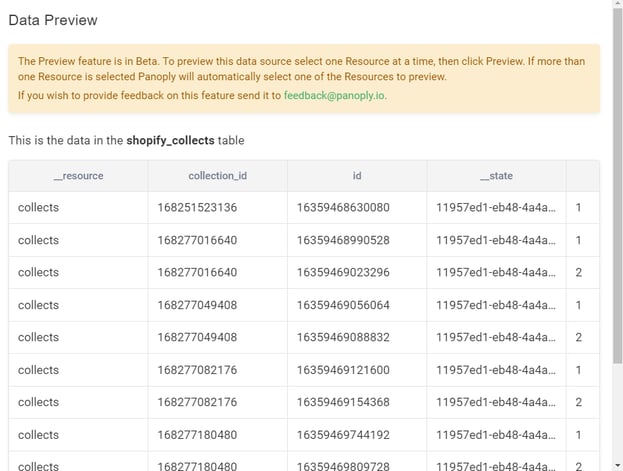
Step 7. You can optionally preview of your data by clicking on Preview.
![]()
If you are pulling more than one table, the system will randomly choose one resource and preview only its data. You can see the name of the table just above the preview grid.
Step 8. Once you’ve set all that up, click on Save Changes to save the changes to the system.

Step 9. Click Collect to start pulling your data into Panoply.
![]()
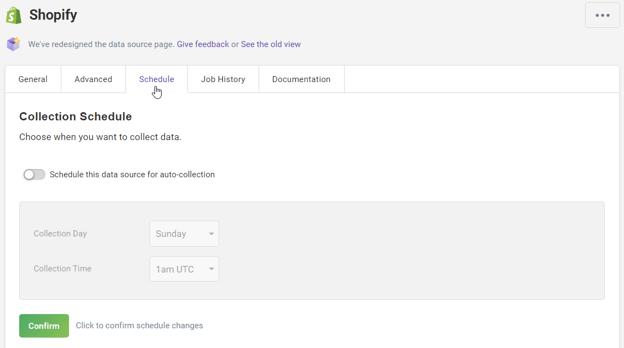
Step 10. You can also schedule this data ingestion automatically by clicking on Schedule tab. These are the scheduling options:
- Every day at a defined time period
- One day at a defined time period
Step 11. And there you go: shortly, you’ll see a notification in the upper part of the window saying your data was successfully collected. Now you are ready to explore your data in Panoply!

Depending on the size of your Shopify store, the ingestion process will take some time. Don’t worry: Panoply is designed to support parallel data processing, so if you need to create another data source, just go ahead. Panoply will notify you when your data ingestion run is completed.
Exploring Your Shopify Data in Panoply
Once you’ve collected your data, it’s time to do some exploring. But before you start, you should know how Panoply transforms the data into tables before storing it. To make this transformation easy to understand, you should get acquainted with the following:
- Nested data structures
- Shopify data model
- Panoply table structure
Nested Data Structures
Nested data structures are hierarchically organized structures that contain a parent-child relationship between the objects and have at least two levels of data. Each element of a structure is either a parent or a child, or both, in case we’re talking about multilevel nested data structures.
Shopify data model is based on this type of data structures, and that is why it is crucial to understand how it is organized. Panoply, on the other hand, transforms this nested data structure into a flat relational model when collecting data.
The reason behind these transformations is that Shopify API’s returns JSON which must be flattened for the data to be stored in Panoply tables.This way, it enables the users to get an easier creation of BI analytics queries. Learn more here.
To be able to understand the Shopify to Panoply data transformation process and to know what you’re eventually looking at in the Panoply data warehouse, it is critical to recognize nested data structures within Shopify. In regard to this, let's take a look at the model which is used for organizing data in Shopify.
Shopify Data Model
For a quick check of the Shopify data structure, let’s explore a Shopify store that sells artistic paintings and how collections of products are organized within the Collections API.
Step 1. The figure below displays the Collections API. You can see here how collections are organized at the parent level of a nested data structure. Only three fields are displayed: the image, the title, and the conditions that the products must match.
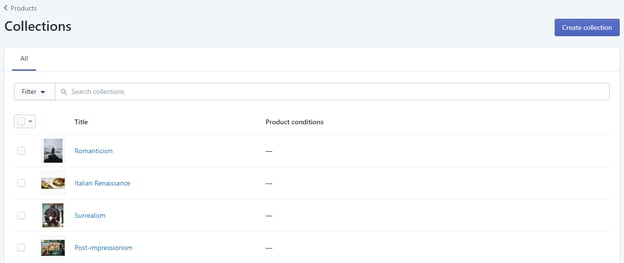
Based on the way a Collection can be created in the system, Shopify distinguishes two types of collections: automatically and manually created ones. However, both collection types are shown in this grid without a clear indication of what type of collection they represent. Panoply solves this dilemma in a very simple way: you will later discover how.
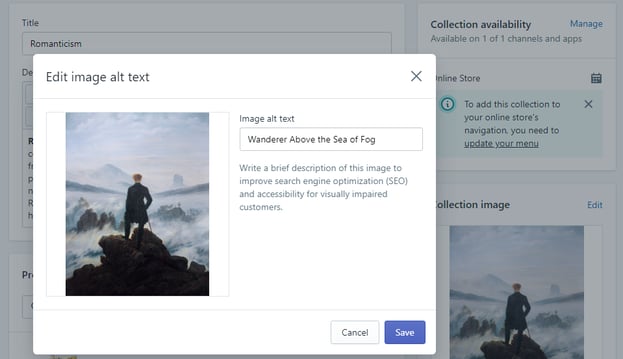
Step 2. If you position and click on a particular collection, a new window will open providing the details on it.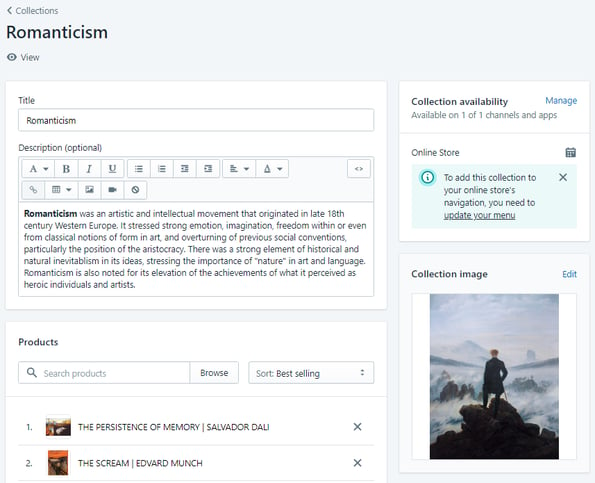
Beside the additional data related to the collection itself (such as description and collection availability), you can see here which particular products belong to this collection, as well as the value which is used to sort the products within the collection.
In terms of child data, you should pay attention to the Collection Image field. If you click on it, you’ll see a brief description of the image. This is the simplest example of a child data within a nested data structure.
Step 3. Your data from the Collections APIs should have gone to a nested data structure like this:
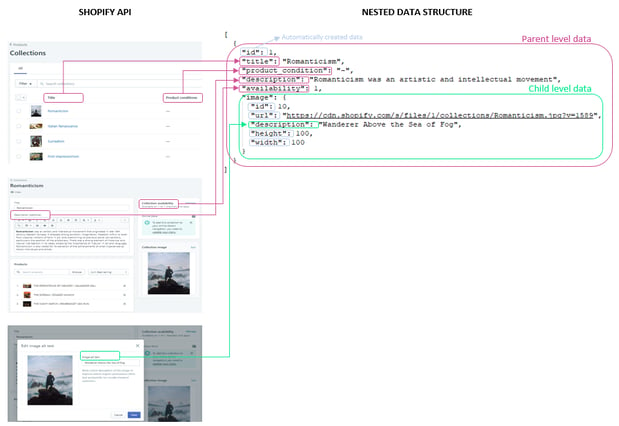
Keep this figure in your mind: it will serve you as a starting point in the Shopify to Panoply data transformation process.
Panoply Table Structure
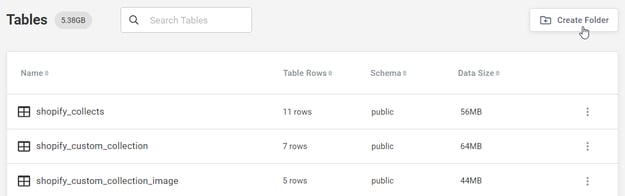
Your data exploration journey in Panoply starts with the Tables tab:

Here you can preview all the tables that are generated by Panoply during the data collection process.
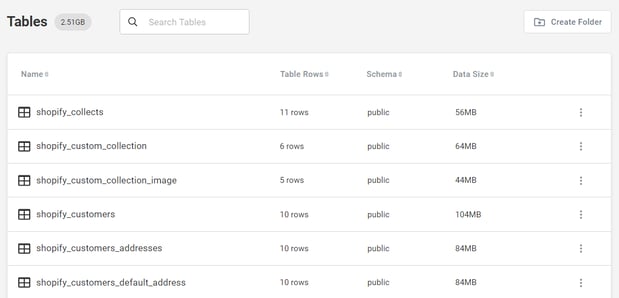
As you can see, Panoply generates a lot of tables. At first you may be confused by all these tables and you may not know where to look for the data you need.
What you need to start with is the fact that Panoply generates 8 logical data groups out of your Shopify data:
- Collects
- Custom collection
- Customers
- Orders
- Products
- Refunds
- Smart collection
- Transactions
You’ve already read in Shopify Data Model section that Shopify doesn’t distinguish automatically and manually created collections. As you can see, Panoply does that by creating two distinct logical groups:
- Custom collection - collections created manually within Shopify
- Smart collection - collections created automatically within Shopify
Shopify nested data model is critical at this point: Panoply uses it as a starting point to create two different types of tables that make its flat relational model. The tables are referenced to as parent and child tables.
Each of the logical groups contains a parent table. Optionally, there can also be one or more child tables. To be able to distinguish between these tables, you need to understand how Panoply table naming convention works.
Panoply Table Naming Convention
Panoply uses a very clear and consistent naming convention that uses data source name and nested data level information for the creation of table objects.
The name of the table is defined as follows:
{data_source_name}_{parent_group_name}[_{child_name}...]
Let’s figure out how Panoply names the tables it creates.
Step 1. In this case, the data source name is Shopify, so all the tables will have a shopify_ prefix.
Step 2. If you know the names of the logical data groups created in Panoply, you’ll be able to identify the parent tables easily. Just put the logical group name in place of the parent_group_name attribute, and you’ll get the names of the parent tables:
-
shopify_collects
-
shopify_custom_collection
-
shopify_customers
-
shopify_orders
-
shopify_products
-
shopify_refunds
-
shopify_smart_collection
-
shopify_transactions
Step 3. All the other tables that are not listed in the previous step are child tables. Visually, they can be easily connected with their parent table based on the same data source and parent group name.
For example, if you want to identify all child tables that are related to orders, you need to look for tables with names that contain the word orders . Let’s take a look at what you’ll find if you type orders in Search Tables text box:
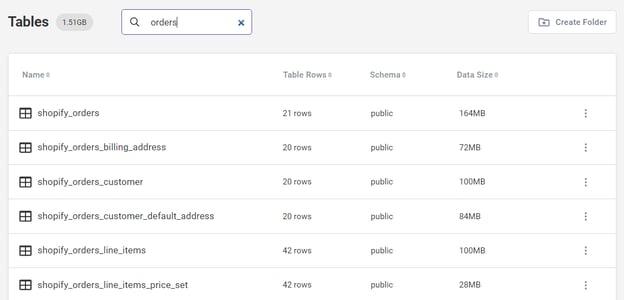
Based on the naming convention related to parent tables, the first table in the results is the parent table. All the other tables are orders’ child tables containing various details regarding the orders.
If a parent group name or a child name consists of many words, each word is separated from the other by a “_” sign.
By default, the tables are created within the public schema and listed in a grid:
Managing Tables in Panoply

You can get basic information inside of this grid: the name of the table, the number of rows it contains, the name of the schema, and the size of the table.
If you click on the
![]() icon related to a particular table, you can see what kind of operations you can perform on it:
icon related to a particular table, you can see what kind of operations you can perform on it:
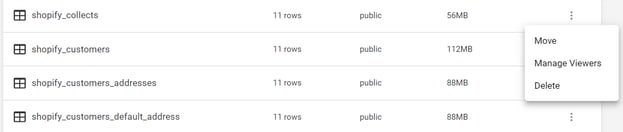
For now, let’s skip the Move option: it will be discussed in detail in the Table Organization section.
The Manage Viewers option allows you to define which users can see the table and query the data inside it.
The Delete option allows you to delete a table. You can perform this action if you belong either to the Admins or the Editors group of users.
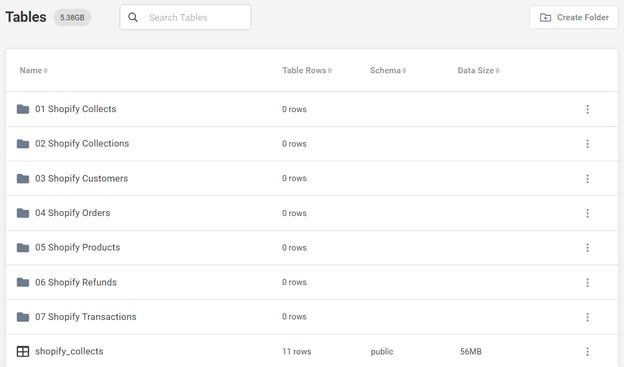
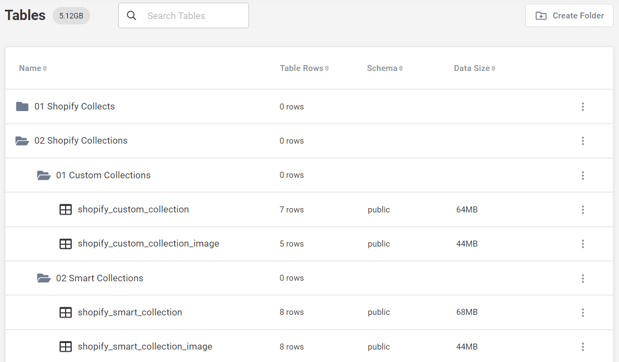
Table Organization
If you want to improve the default visual organization of the tables within the grid, you can create folders and move the tables in them. You can use any organizing logic that you like but for this example, we will create eight folders, each for a specific logical data group. Then you can move a particular parent table and its child tables into the corresponding folder. So, next time when you decide to query your data, you’ll spend less time searching for a particular table: you’ll already know which folder to look in.
Organizing tables into folders is a pretty simple process.
Step 1. To create a folder, click on Create Folder in the right upper part of the pane.
Step 2. Give the folder a name and click on Accept.
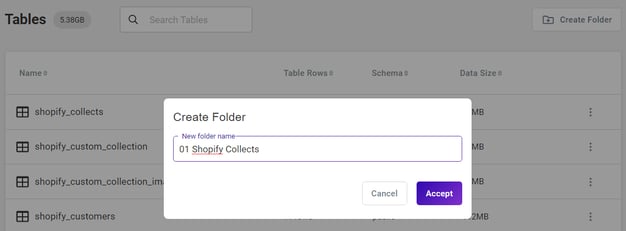
There is no option to edit the name of the folder once you’ve created it, so be careful. In case you need to change the name of the folder, you’ll have to delete it and recreate it with a different name.
Step 3. As you create folders, they start to appear at the top of the list.
Step 4. You can also make subfolders: just click on ![]() icon related to a particular folder and click on Create Subfolder.
icon related to a particular folder and click on Create Subfolder.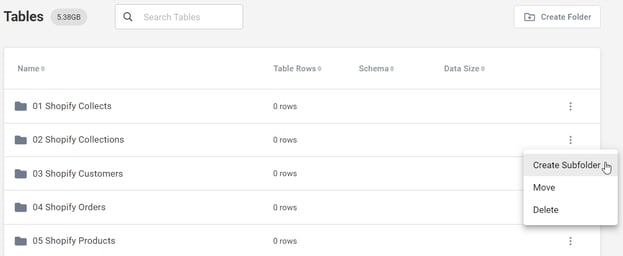
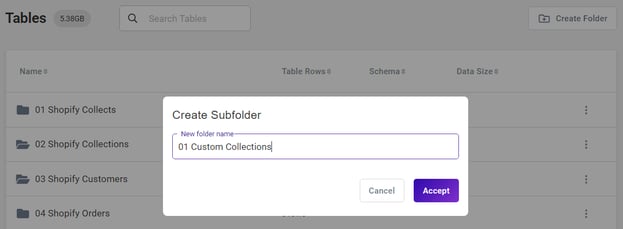
Step 5. Give a name to the subfolder and click on Accept.
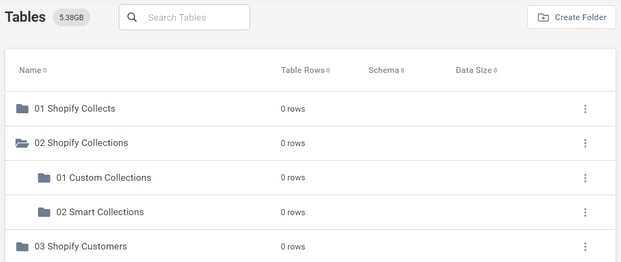
Step 6. Click on the parent folder: it will expand and you will see all the subfolders created in it.
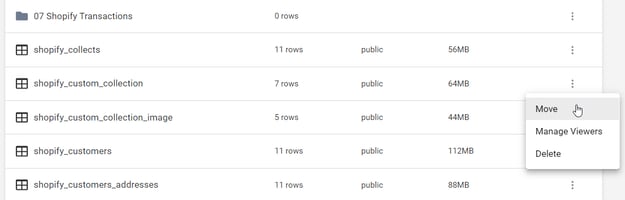
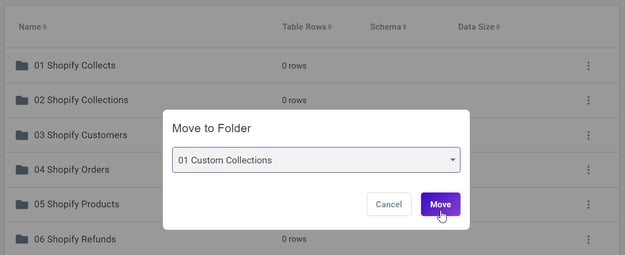
Step 7. Now it’s time to move some tables within the folders. Click on ![]() icon related to the table that you want to move, and click on Move.
icon related to the table that you want to move, and click on Move.
Step 8. Choose the folder where you want to move the table and click on Move.
Step 9. Repeat previous steps for all tables if you want them to be organized this way.
Don't let the search result of such a structure confuse you. If you search for a certain word, the search result in the data grid will not be displayed in a hierarchical manner.
For example, if you search for objects that contain the word "collection", the search result will look as follows: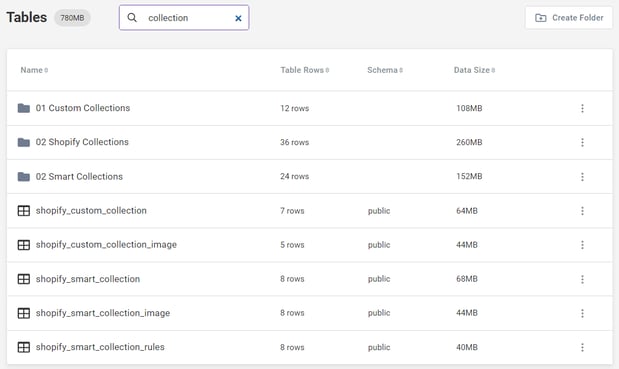
However, if you click on a particular folder, its structure will appear immediately: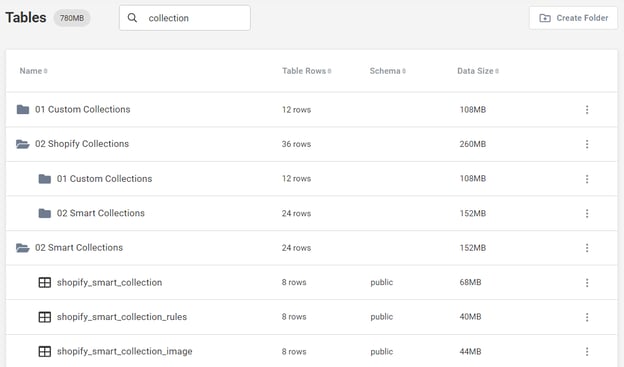
Table Structure
Look at the structure of the table:
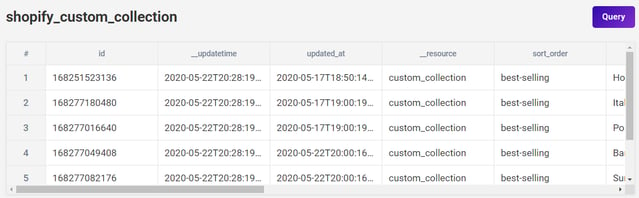
Panoply generates a key for each table it creates. The key column is always named the same: id. There is one more thing interesting about Panoply tables: during the data ingestion process some columns are also automatically created. These columns, unlike the id column, are typical metadata columns. However, they don’t contain metadata about the table data itself, but about the resource from which the table was created, its state, as well as the data transaction process. You can easily distinguish them from other table columns: their name starts with “__”. Each table contains the same four columns of such type:
- updatetime
- resource
- state
- senttime
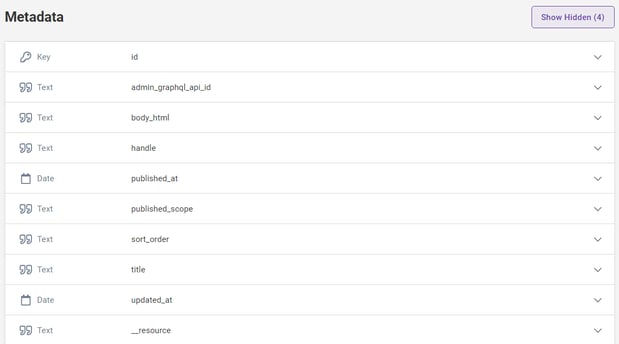
Just below the data grid, there is the Metadata section. Use this in case you need additional information on a table column. On the left side of the column name, you’ll notice the information about the column type. The exception is the id column: here you don’t see its type, but the information that it is a key column. By default, metadata columns whose names begin with “__” are hidden: you can see them if you click on Show Hidden in the right pane.
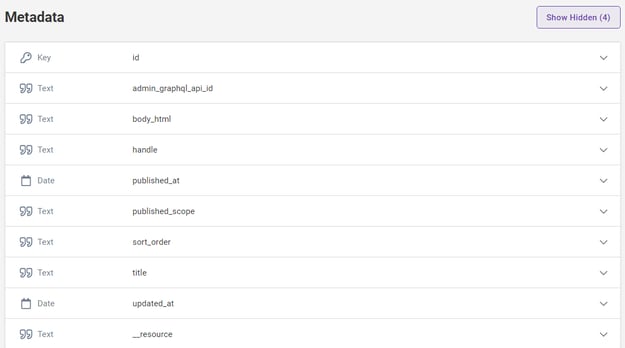
Click on  icon on the far right to expand a particular metadata field and explore its details. Same properties are collected for all table columns, and they are more or less self-explanatory, so it’s mostly easy to understand what they represent.
Logical Joins Between a Parent and a Child Tables
The relationship between parent child tables in Panoply is based on keys, as in any relational model. To be able to join the tables, Panoply automatically creates a column within each child table that contains the same value as the key column of its parent table. This column will serve to create a parent-child relationship between the two.
There is also a column naming convention related to such automatically created columns. The name of the column is defined as follows:
[parent_table_name]_[id]
Take a look at Custom Collections data group. This group contains a parent table called shopify_custom_collection and only one child table called shopify_custom_collection_image.
If you take a look at the child table, you’ll notice there is a column named shopify_custom_collection_id. That is exactly what we need to implement table joins. Accordingly, the tables will be joined as follows:

The following script applies the join from the figure above::
SELECT scc.id AS collection_id,
	scc.title,
	scc.description,
	scc_i.id AS collection_image_id,
	scc_i.height AS collection_image_height,
	scc_i.width AS collection_image_width
FROM shopify_custom_collection scc
JOIN shopify_custom_collection_image scc_i ON scc.id = scc_i.shopify_custom_collection_id
ORDER BY scc.title
Once you’ve figured out the tables’ structure, you are ready to start manipulating with data in your tables.
Data Mapping From Shopify to Panoply
Remember the figure from the beginning, the one that displays how Shopify organizes its data? Let’s start from there and see how that data is mapped into the Panoply data warehouse. For easier understanding, the starting point will be Shopify APIs.
This is how Shopify to Panoply mapping process looks like:
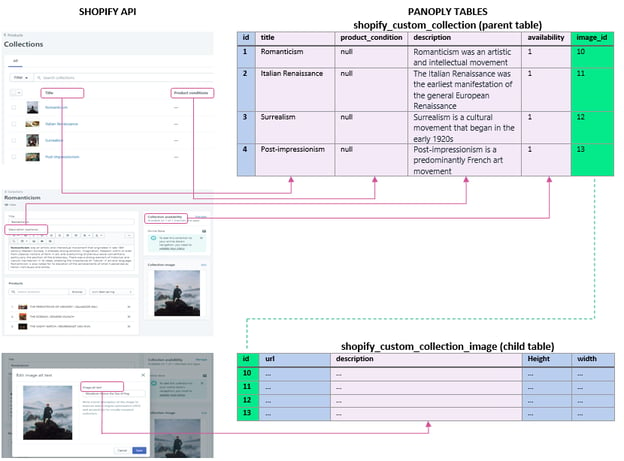
As you can see, there are some columns which are automatically created within Shopify. Their values can’t be seen in the Shopify APIs, but Panoply takes them and stores them in its data warehouse. Such columns are colored in blue and green: image_id, id, url, height, and width of the collection image. You can find these columns in the shopify_custom_collection_image Panoply table.
However, there could be some Shopify columns that Panoply simply ignores. Such columns don’t have any influence on reporting any kind of data insights that might be of help to you. The example of such columns is the collections’ availability: you can’t find this information in the Panoply custom collections in neither parent nor child tables.
Before you start exploring your data, we advise you to first carefully read the previous three subsections. Try to fully understand the previously mentioned concepts: nested data structures, and Shopify and Panoply data models. You’ll feel much more confident about working in Panoply knowing how these things work, plus you’ll be able to create your own analytics in just a few clicks!
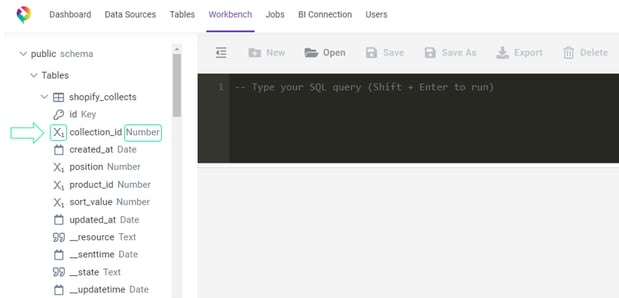
To get started, click on Workbench on your Panoply dashboard in the left upper pane.Data Manipulation in SQL

On the left side, you can make a preview of tables and views created within the public schema.
During the data ingestion process, Panoply automatically creates tables. If you open one table within the Tables section, you’ll see that each column name has:
- An icon on its left side indicating the data type
- The data type name on its right side
On the right side, there is a sub-menu which allows you to perform data manipulation. Beside running queries (Run or Shift+Enter) and exporting result sets as CSV files (Export), you can also do some manipulation on views:
- Click on Open to open the existing views
- Click on Save to save the current view
- Click on Save As to save the query as a new view
- Click on Delete to delete the current view
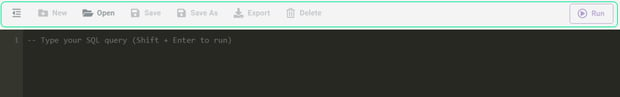
Unlike tables, there are no automatically created views: views are best defined by your own business logic.
Creating views in Panoply couldn’t be easier at this point. Now when you know what data you have in your data warehouse and how it is organized, you are just a few steps away from creating views which will serve you as the basis for visualizing your data insights. So, let’s get started!
Creating Views in Your Data Warehouse
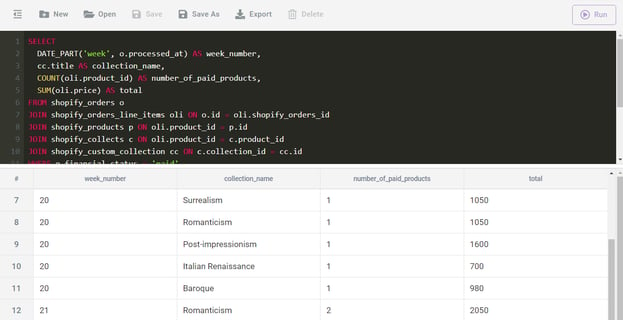
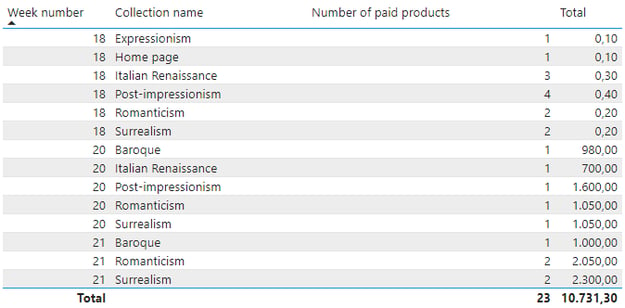
The scenario is the following: You want to create a report that you don’t have by default in Shopify Analytics. The report should display the number of paid products arranged by product collection category and the number of the week in which the order was processed.
Before creating the report in a BI tool, what you need to do first is to create a view that generates the information you need.
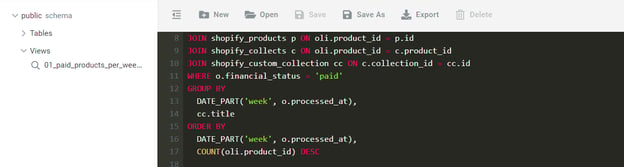
Step 1. Create a select statement that will make up the view.
SELECT DATE_PART('week', o.processed_at) AS week_number,
	cc.title AS collection_title,
	COUNT(oli.product_id) AS number_of_paid_products,
	SUM(oli.price) AS total
FROM shopify_orders o
JOIN shopify_orders_line_items oli ON o.id = oli.shopify_orders_id
JOIN shopify_products p ON oli.product_id = p.id
JOIN shopify_collects c ON oli.product_id = c.product_id
JOIN shopify_custom_collection cc ON c.collection_id = cc.id
WHERE o.financial_status = 'paid'
GROUP BY DATE_PART('week', o.processed_at),
	cc.title
ORDER BY DATE_PART('week', o.processed_at),
	COUNT(oli.product_id) DESC
Step 2. Run the query to preview the result.
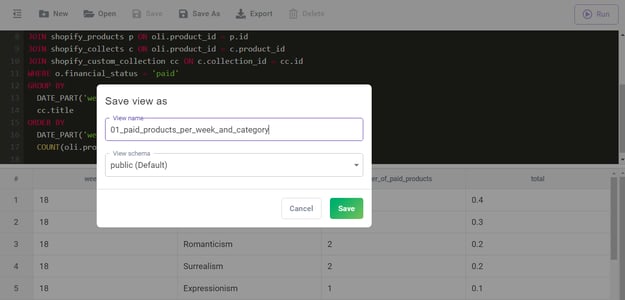
Step 3. To create a view, click on Save As, give the view a name, and click on Save.
Step 4. Check out the Views section: your view should be there.
Now when you have the view that returns the data you need for your report, it’s time to see how to connect to a BI tool from Panoply.
After you have created the view, click on Tables within the Panoply dashboard to see what happens: you’ll see your view there as well. So, Tables window doesn’t enable you to only see and manipulate physical tables created within Panoply, but user-defined views as well.
Panoply is very flexible when it comes to creating visualizations out of its data: it allows you to connect various BI tools to its data warehouse and create all the visualizations you can imagine. Let’s find out how to visualize our Panoply data by using one of Microsoft’s newer platforms for analyzing and visualizing data: Power BI.
Visualize Your Data Insights With Power BI
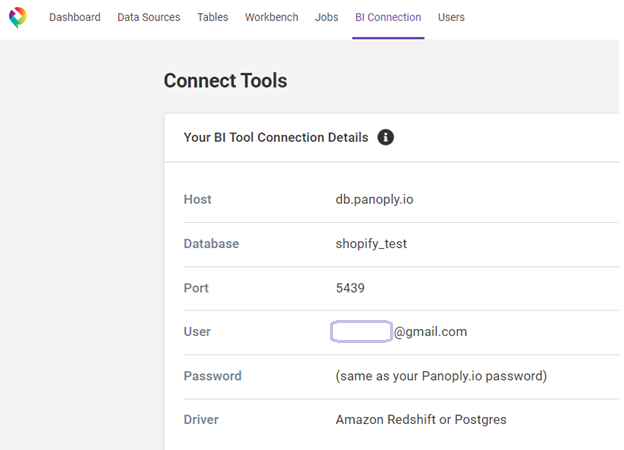
For a start, go through the first six steps described here to connect Power BI to Panoply. Pay attention to step 4: you’ll need to enter some configuration data from Panoply. But where do you find this data? Just click on BI Connection on your Panoply dashboard in the left upper pane, and you’ll find everything you need.
After you have finished step 6, you’ll get to the Navigator pane. As you can see, you’re able to preview all the objects within your Panoply database. Select the object(s) you want to use and click on Load.
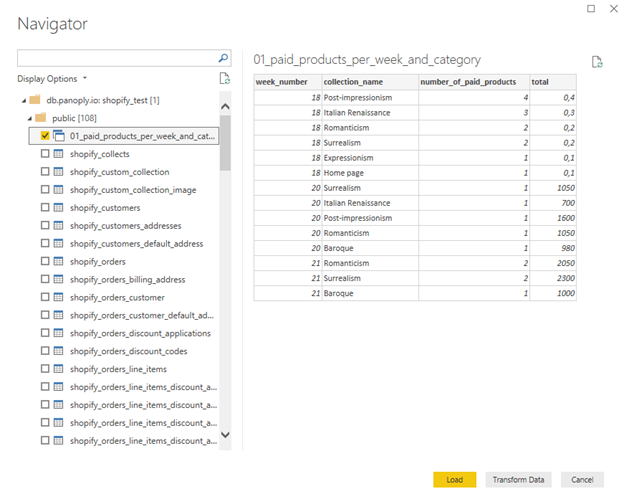
The object(s), in this case the view, is ready for manipulation.
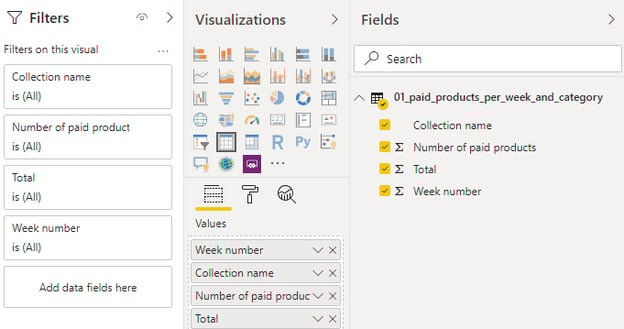
Construct your report the way you want it (in the example below, we’ve made a tabular report and a stacked bar chart), and there you go: you are ready to analyze gathered data insights and improve your business accordingly.
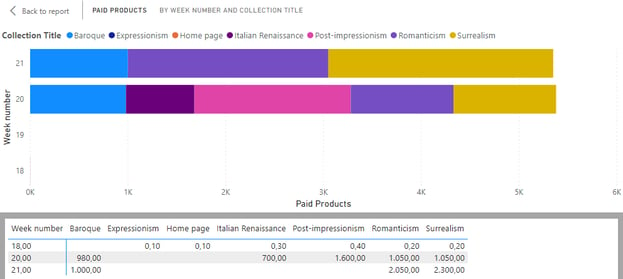
Compare how data is sorted when running the view in Panoply and when displaying its result set here in Power BI. Even though the view in Panoply is created to sort the result set by multiple columns (week number and number of paid products), Power BI ignores it and allows the sorting to be performed on only one column by default -- in this case this is the week number. However, you still have the option in Power BI to sort the data by multiple columns, you’ll just need to perform additional gymnastics to do that.
Summary
Performing data analysis is a common operation when it comes to data originating from online eCommerce platforms. Being able to manipulate your data easily is a very useful skill when working with datasets coming from such sources. You have seen how Panoply makes data manipulation painless: in just a few clicks you are able to collect, analyze, and visualize your data insights.
This blog post reviewed the basics of using Shopify data in Panoply. If you’d like our data architect to show you Panoply in action, be sure to request for a demo. However, if you’d like to explore the options that Panoply offers by yourself, take a look at our documentation and get started with your Panoply adventure!


