Preparing data for Business Intelligence (BI) can be a very tedious and time consuming process. You want the data to turn into the best reports for analysis. But, the raw data needs lots of processing and handling before you can even approach the results. In addition, it’s essential to make sure data is collected and shared across the whole organization. Gartner calls this the “democratization of analytics.”
So, how can you make this happen? The main challenge is planning and building the combination of several data sources tables into quality reports that support the business and answer multiple questions for the same topic. For example, reporting on your online service’s “daily active users” and also answering questions about the region source, the devices they use, etc. - ensuring that the right data resolution and granularity is available for your multiple reporting requirements.
In this article, we provide practical inputs and insights for data architects and engineers to help in the crucial step of BI data preparation. First, we give some how-to information and then some ideas to streamline the process.
Overview - What are we looking for?
Let’s start with the end results - the report or dashboard you desire to see. We’re looking for useful business information to gain insights and drive the business forward.
Here’s an example of a report for daily active users (DAU) by country :
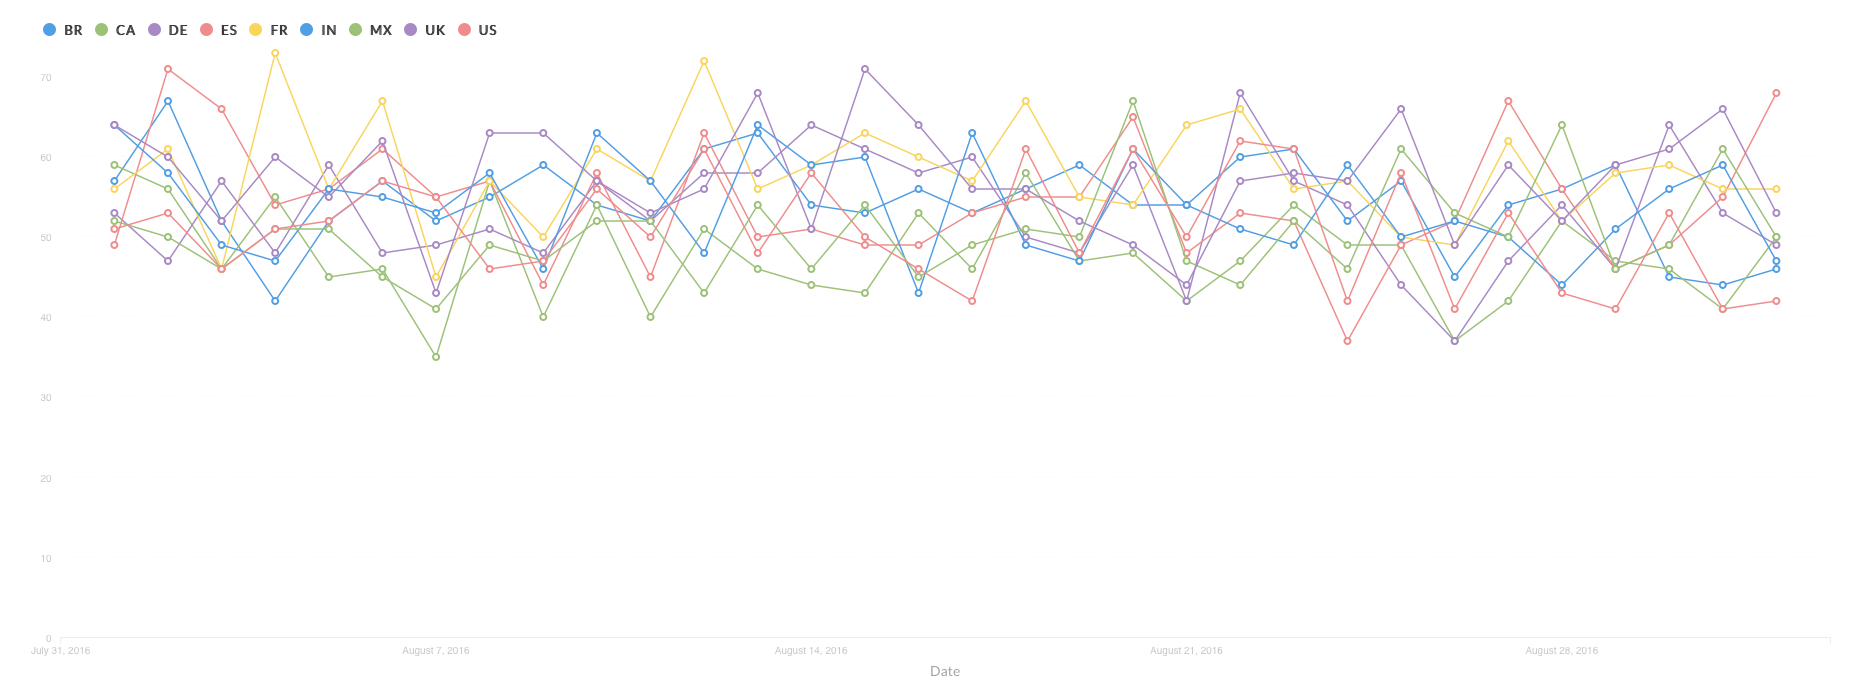
This report is a collection of powerful data that enables an overview of daily active users by their country. It helps product owners and business managers to focus their efforts on the regional trends.
In general, business analytics and reporting are enablers for business owners and leaders at all levels to change and direct their product. However, getting these results isn’t necessarily a straightforward endeavor:
The data may contain lots of anomalies and duplication - require redundancy removal, normalization across the different data sources, and varying granularity.
It’s also a challenge to get the data ready for everyone - not just the business owner and developers, but also for the CMO and key decision-makers.
Plus, infrastructure and tool challenges might actually slow down access to your data, and limit your ability to offload mundane tasks that take time and hamper focus.
So, we’ll drill into the process step by step to show you what you need to do to get a report that’s right for as many people as possible in the business - not just the business owner.
A step-by-step example
To reach our desired results, there are several steps to take to go from raw data to useful analytics:
- Collect and load data
- Transform data to be BI ready
- Test system with manual queries
- Build the reports
An important note: In this step-by-step example, we don’t follow the traditional ETL sequence, but the more modern ELT approach. First, we load (L) the data into a Panoply data warehouse and only then run the transformations (T) to prepare the data for BI. In the specific case of this example, the tables are ready for loading from CSV files, so the extract (E) step is not shown.
1. Collect and load data
Collecting data entails uploading the data into the data warehouse like Redshift, so that you can leverage its relational database features and capabilities.
There are several ways to collect data and insert it into Redshift. Let’s see how to do this to create reports like the one shown in the previous section. In this case, the tables are in 3 CSV files: sessions, users and devices.
As shown below, we use Panoply.io to choose and quickly upload the CSV files to Redshift. You can also load the collected data into Redshift manually using COPY command but this will require a few more steps.
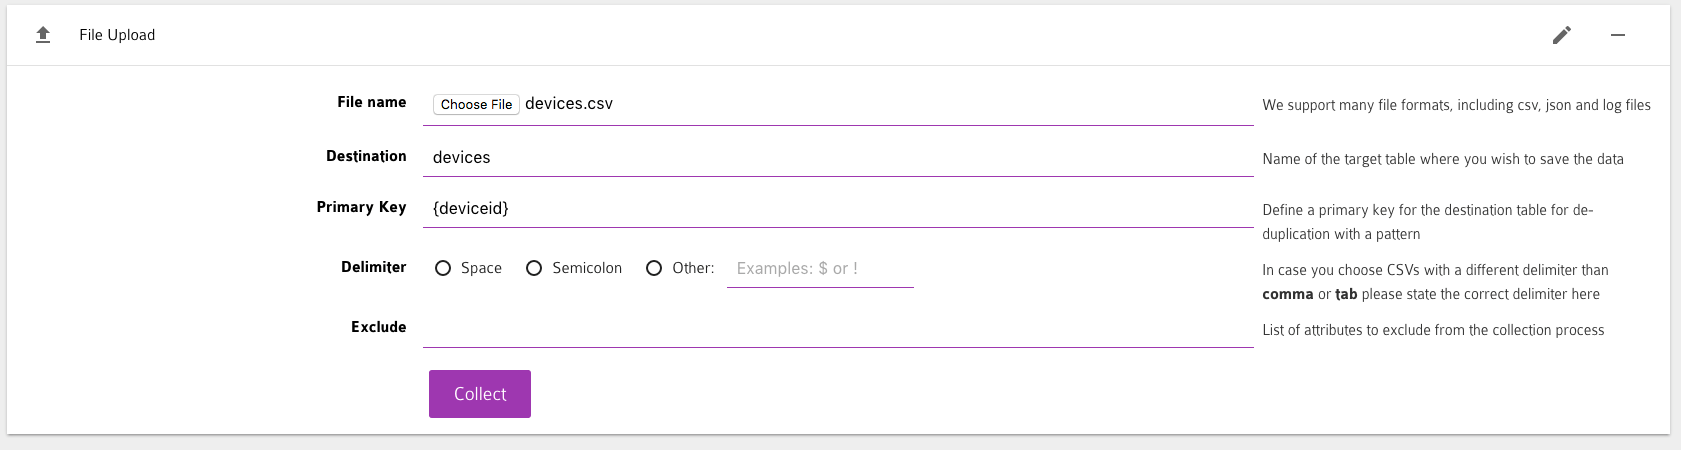
To create the report, we uploaded 2 additional CSV files in a similar manner. Note that you can upload data from many disparate data sources using AWS Redshift.
2. Transform data to be BI ready
The best way to start this step is by investigation using manual queries on the loaded raw data. You can then evaluate the quality of the data and decide which tables are not relevant or need to be changed. Then, plan and decide on the right transformations accordingly.
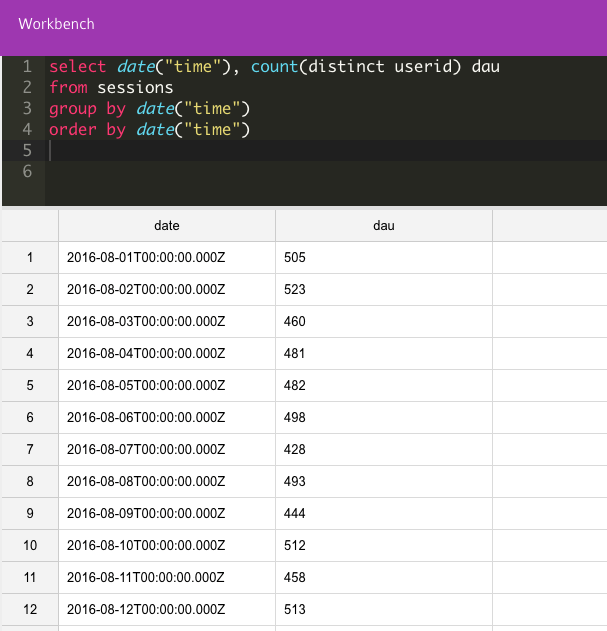
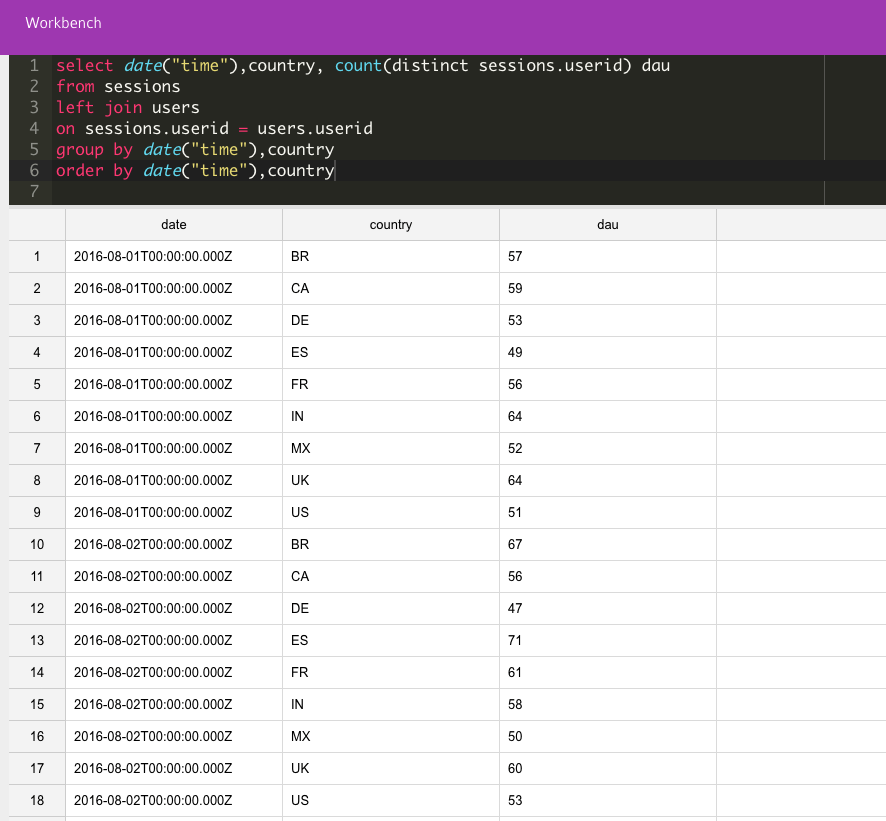
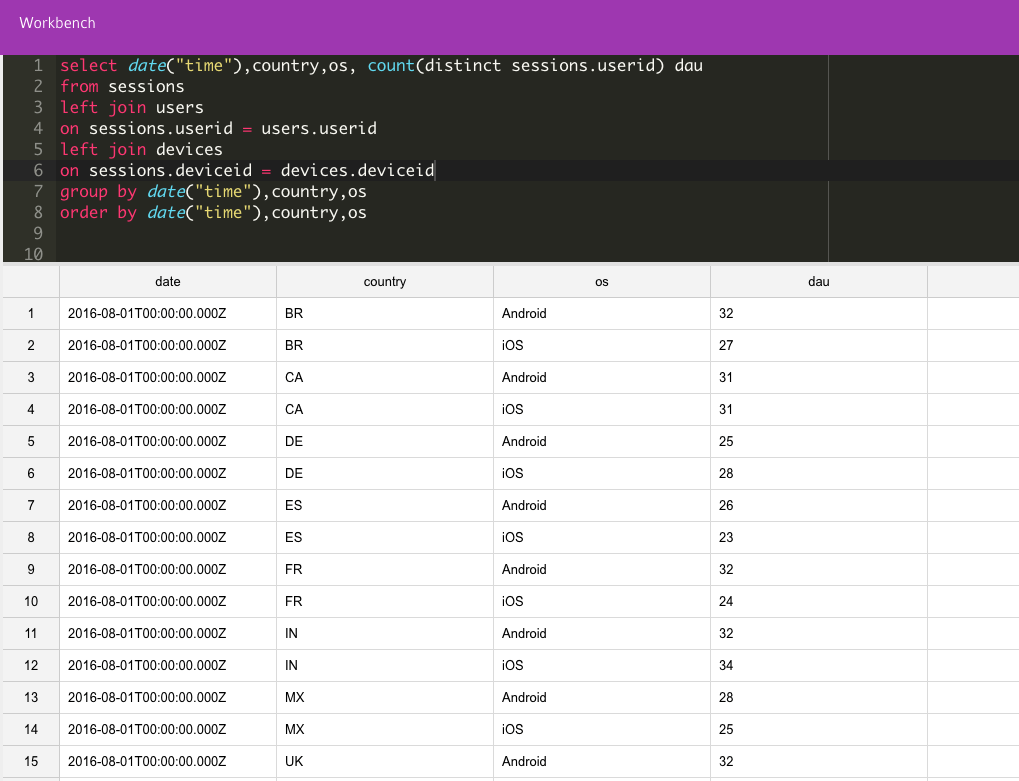
If we continue with our example, here’s how we use Panoply.io to calculate DAU, DAU by country and DAU by country and device type (based on the operating system). Note that although each of these queries is correct for its own calculation, the data may need to be normalized to allow provision of the right results in other queries.
Users counted by time
Users counted by country
Users counted by country and the device operating system
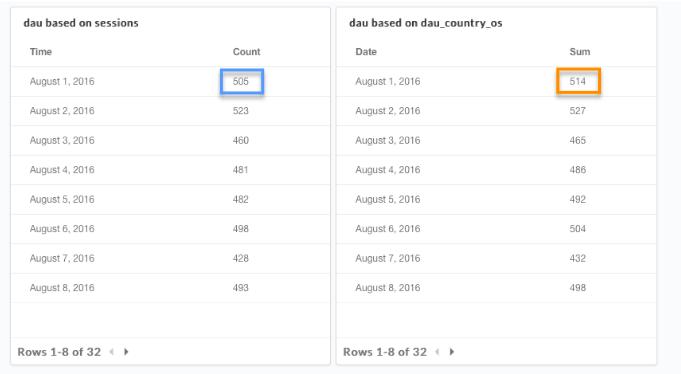
Once all our data has been loaded into the data warehouse, we have the flexibility to continue with our investigation on the raw data. We now consider different dimensions such as by comparing DAU to DAU by country and OS, using the following transformation queries:
For simple DAU: SELECT date(“time”), SUM(dau) FROM dau GROUP BY date(“time”)
For DAU from the country & OS: SELECT date(“time”), SUM(dau) FROM dau_country_os GROUP BY date(“time”)
As you can see in the below query outputs, the results in the right table are greater than the results in the left (that is due to cases when a user has a few devices, so each device might be counted multiple times, although it’s the same unique user).
To transform the data to be BI ready, using multiple data sources and structures is the best method. A rule of thumb is that it’s not just one table since you need to continuously find good combination of information involving several tables.
So, taking our example to the next step: In our case we want one transformation that will allow us the flexibility to answer many questions (DAU, DAU by country and DAU by country and OS). However, as we saw in the comparison table above, we can’t calculate the DAU using the more granular transformation (DAU by country and OS), since we won’t be able to answer all three questions with that transformation only. In order to solve this issue, we will need to use a higher resolution transformation that’s grouped by day, userid, country and OS:
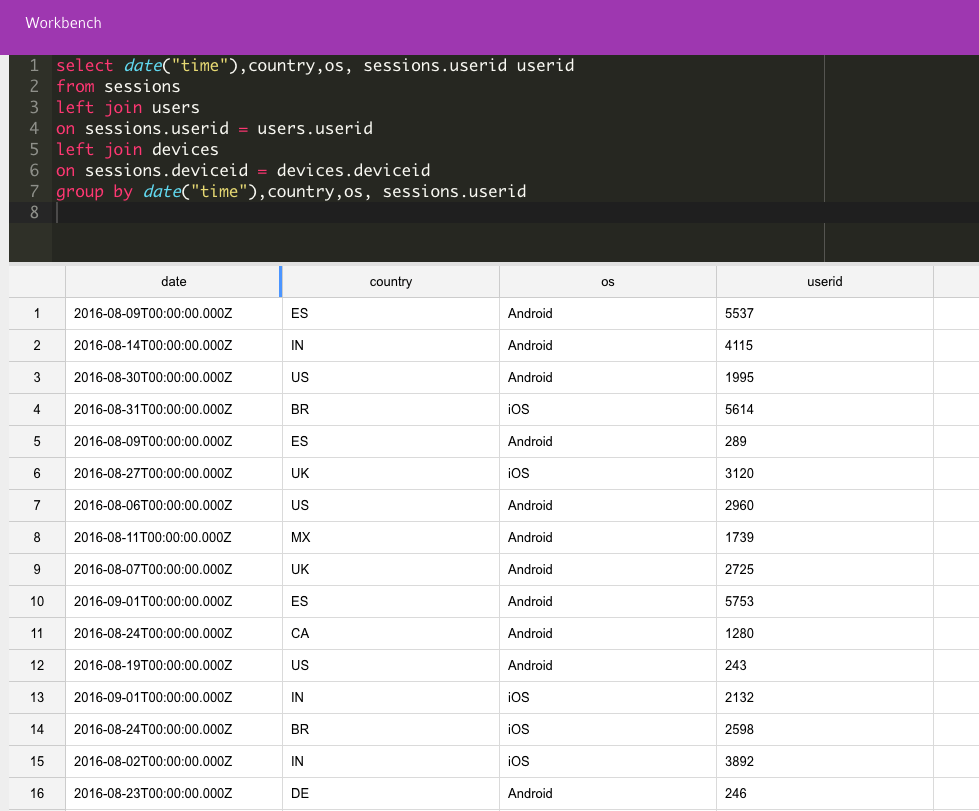
This transformation will give us 1 row per date, country, OS and userid, and when we count the distinct userid using this transformation, it will always give us the correct answer:
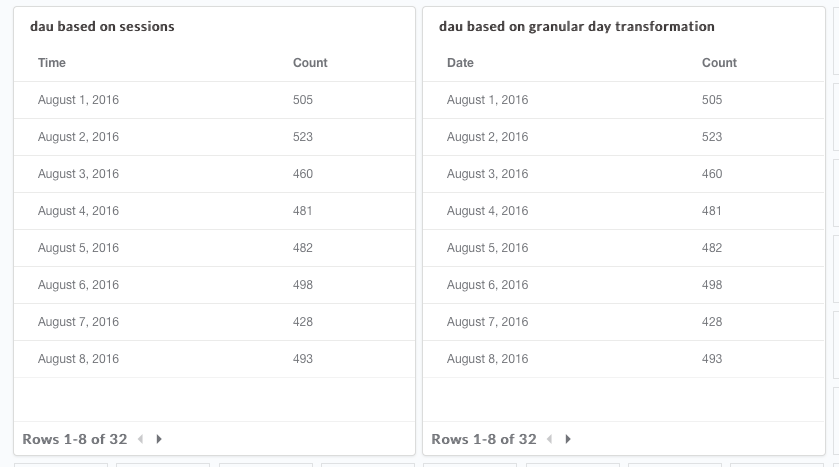
3. Test the transformation with manual queries
As shown above, try getting the same result using different manual queries. In this step, you can also pull the results data into a spreadsheet (a sample of the data should be enough), or even manually count the result and compare it to the result obtained from the transformation.
4. Build the reports
Create end user reports and charts with the right granularity and resolution, like DAU per device, country, etc.
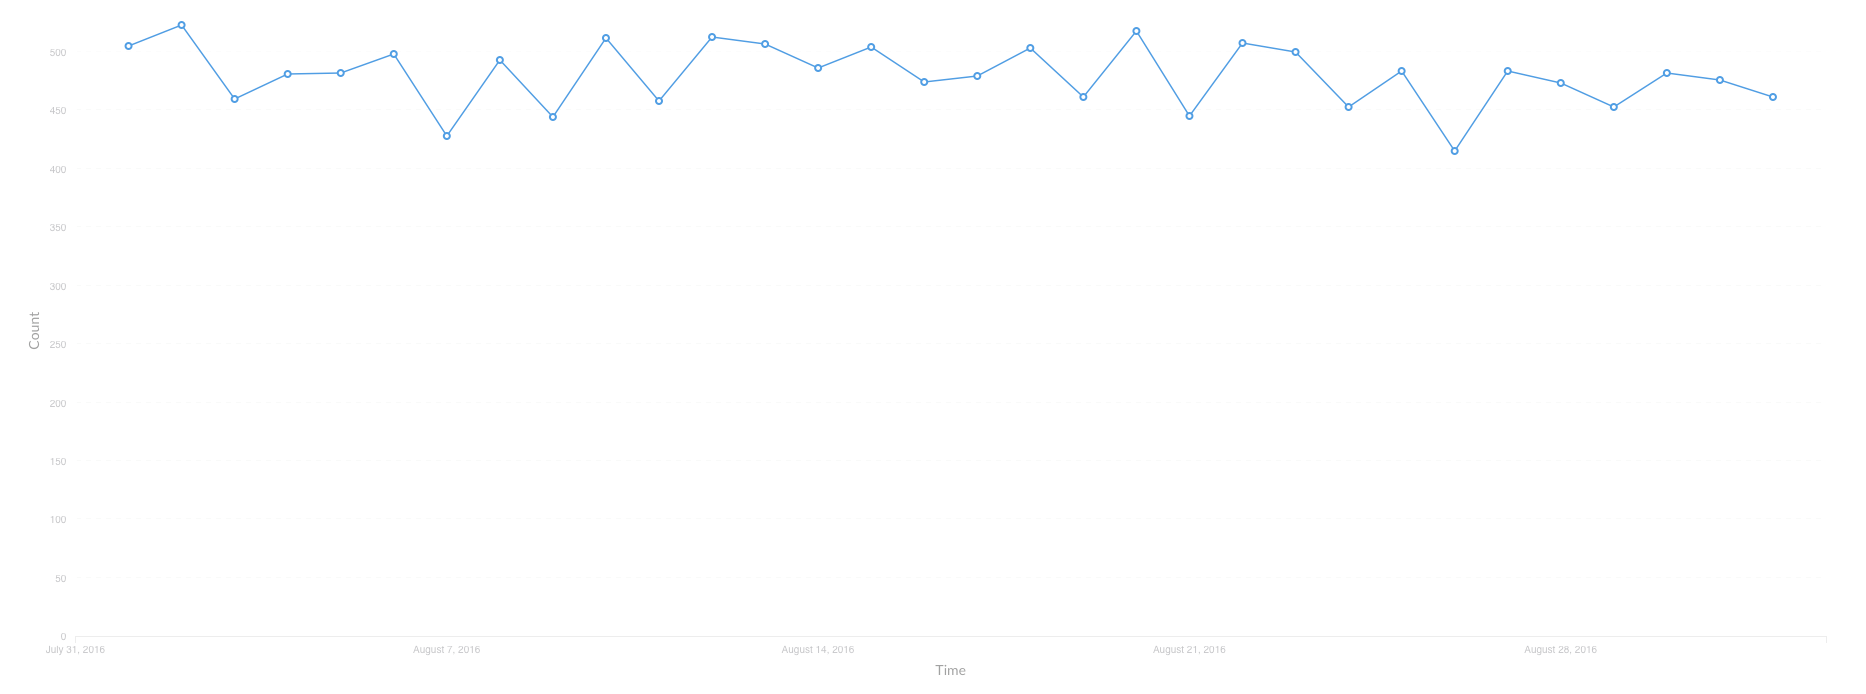
Here’s the results from our example:
DAU over time
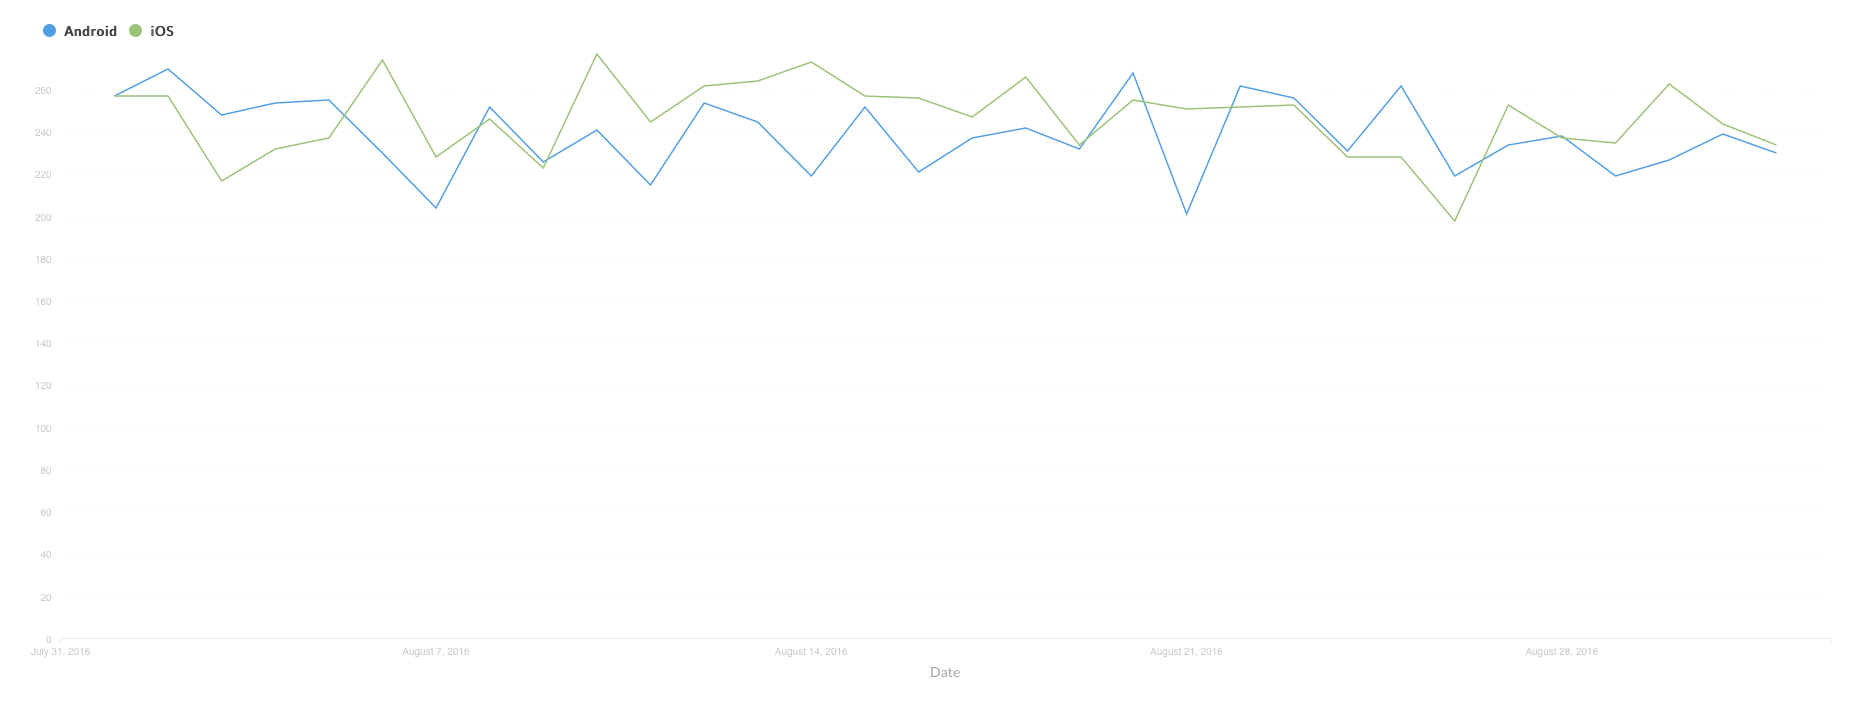
DAU by device
DAU by country

5 Practical Tips
We’ve demonstrated what you need to do to get your data ready. Here are some lessons learned that can upgrade your work:
TIP 1: Simplicity and flexibility - Keep it simple and make it as granular as you can. Don’t try to overload the solution for all instances using comprehensive calculations and aggregations.
TIP 2: Test, Test, Test - Going back to the how. As in any software project, you need to focus on good quality assurance (QA). Always check and double check using manual queries and even use spreadsheets to validate results and ensure you get the right numbers.
TIP 3: Naming conventions - For usability and maintenance, naming is one of the most important items - you don’t want to start maintaining tooltips and documentation that won’t be used anyway… Therefore, you want to make names intuitive, including fields, transformations queries, and reports. If it’s not a known KPI (like Daily Active Users or the abbreviation DAU), find another name that is well-established in the organization or used in the industry.
TIP 4: Slim is faster - Work iteratively. Run quick analysis on raw data, prepare the best report quickly and get the business user feedback. Since we have all raw data loaded we can always enhance and test different transformations going forward.
TIP 5: Teamwork - Focus on good communication between everyone on the team - including the business owner, product management and developers. Make sure you understand the user work flows and business goals to support the team by collecting the right data and transforming it to valuable assets.
Final Note
How can you cut down on the overload and have more time for analysis? Remember that BI isn’t generic. Make sure you create a process supported by the right toolset that’s tailored to fit your business needs. It’ll help you to keep your focus on the business issues instead of spending time on development and processing. The right combination of tools and processes will lead to better performance, more efficiency and lower cost - enabling the BI results and statistics for your business success.


