Data flows like never before, and with so much at our disposal, making the best use of it is a challenge. Many businesses use Google Sheets for everything from content planning or list building, to financial reporting and KPI tracking. While it is a powerful tool, it has certain limitations when it comes to data analysis. Getting your data out of Google Sheets and into a data warehouse can unlock even more business insights.
By storing all your organization’s historical data in one place, a data warehouse lets you analyze everything together. The more data you have, the better a resource it will be, both in variety and volume of data.
With some help, you can leverage everything you gather and connect the dots, turning it into useful information that can drive better business decisions.
What’s Panoply and how can it help you?
Independently setting up a data warehouse isn’t easy, but Panoply makes it a breeze. With our managed data warehouse, you don't need to worry about figuring out any of the intricacies for yourself—the moment you create an account we spin up a Google BigQuery warehouse for you, and you're ready to start filling it with data.
Panoply also makes it easy to collect data from different sources into a single source of truth (your data warehouse), and then push that data into your business intelligence (BI) tool.
Helping teams contribute as efficiently as possible makes it a more valuable resource, and everyone can benefit from the insights provided by analyzing your data.
Get Data from Google Sheets into a Warehouse
Google Sheets is one of the many data sources Panoply works with. Setting it up is simple, and you can move data to your warehouse with minimal fuss. It’s really just a case of picking a file and letting Panoply do the rest.
Merge your data with other sources
Panoply allows you to merge your Google Sheets data with other sources you use. It can connect to a massive range of different software and features a variety of integrations. These include databases, e-commerce software, advertising platforms, business intelligence software, and much more.
Get deeper insights with centralized data
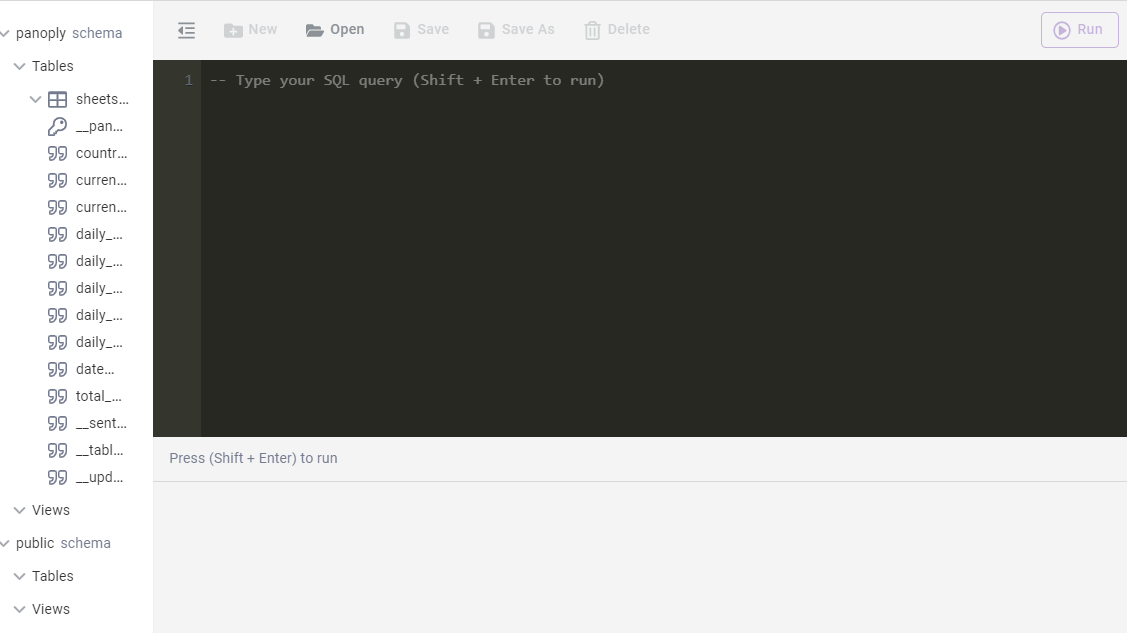
Once you’ve collected the data, you can analyze it in various ways. Panoply allows you to run SQL queries on your data directly in our workbench.
Have less brittle, more reliable data storage
Say goodbye to hunting down a broken formula somewhere in your spreadsheet, or having to undo all the changes the you just made when you manually updated the wrong column of your report. Panoply is a robust system allowing you to share data without having your work overwritten by other users. It uses permissions to prevent unauthorized users from deleting or changing what they shouldn’t.
Panoply also includes a Data Ingestion Engine that transforms data into a consistent format. That’s especially useful for handling dates and timezones, as those of you that have fallen down that rabbit hole will be aware.
Use cases for Panoply with Google Sheets
Collecting and analyzing data has almost endless uses. I’ll go through a handful of common scenarios, but there are many more.
If you don’t see yours listed, don’t hesitate to get in touch with Panoply and see how it can work for you.
1. Financial reports
Your accounting and financial teams likely keep detailed records of your incomes and expenses, and these are good candidates for analysis. Spreadsheets are widely used in accounting and finance, and many teams use Google Sheets as a shared data source.
Spotting patterns in your income streams can help you orient your business to maximize them. Similarly, keeping close tabs on business costs can help you figure out how to reduce spend or allocate resources more efficiently.
Data in Google Sheets can be combined with data from accounting and payment platforms, such as NetSuite and Stripe.
Finance data is naturally sensitive, both in commercial terms and in that it can contain information that needs to be kept private.
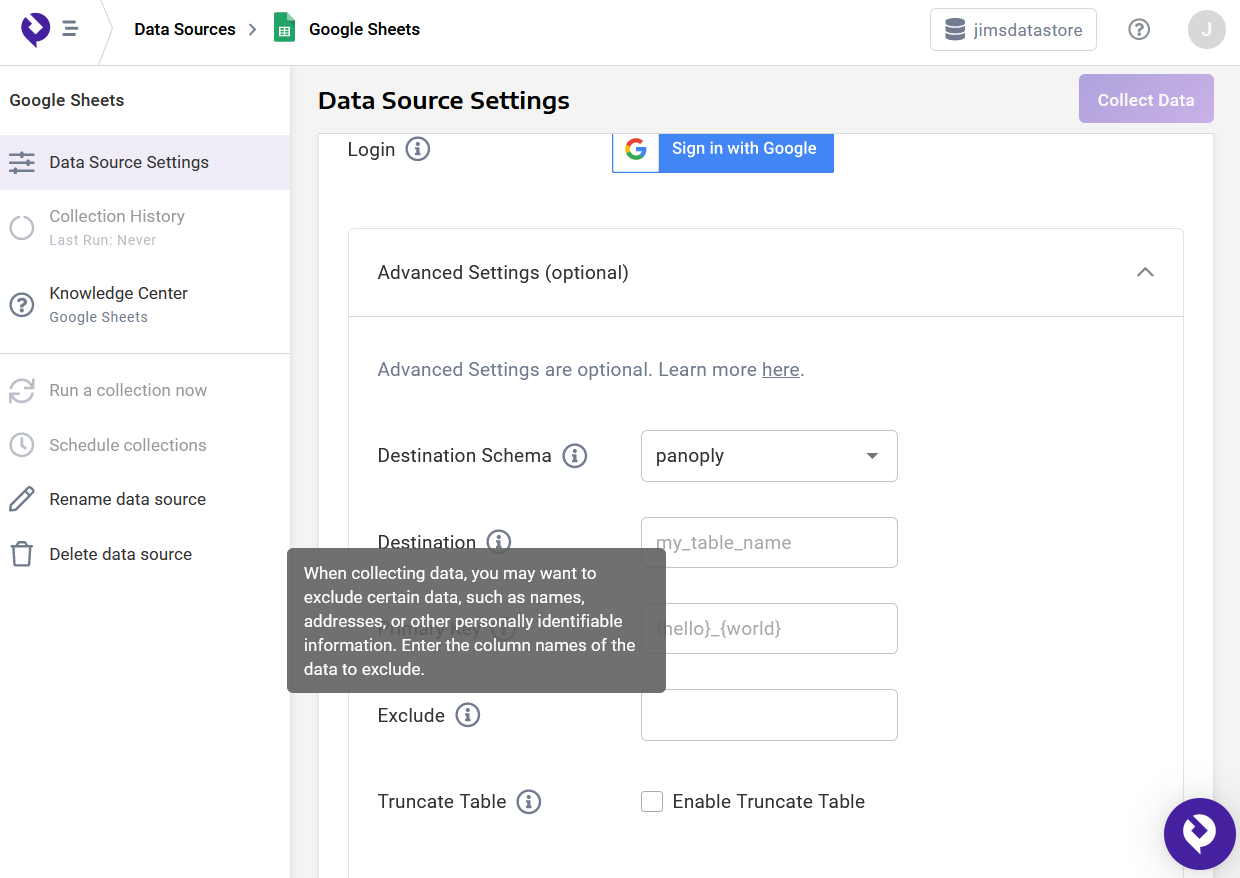
You can use Panoply’s advanced settings to remove confidential information from the data. That way, you can share it without breaching privacy rules or compromising your departments.
2. Inventory management
Google Sheets makes an excellent inventory tracking tool. Whether your data is entered manually or connected to your sales system, it can handle large volumes of inventory and provide an at-a-glance view of what you need to order.
With Panoply, you can pull this data into your warehouse. In addition, Panoply works with various e-commerce tools, such as Shopify, Square, and WooCommerce, along with support platforms, like Zendesk. Hence, Panoply is well-positioned to combine and use this data.
Your inventory system can be connected to your order and sales systems, perhaps sending alerts to suppliers or those who need to approve the orders. You can also use the data to figure out when drops in stock are happening and see if there are any patterns that can help your restocking process go more smoothly.
It can also help you track depreciation, which is especially useful if you’re in a business where your stock value declines over time, like car or electronic sales.
3. Team or business KPIs
If you’re using Google Sheets to record your team’s key performance indicators (KPIs), that’s valuable data for your data warehouse. You can combine the information with other metrics, so you can see the impact it has had.
For example, why not link your performance indicators with data from sales, or the support team, to quantify the broader effects of improved performance?
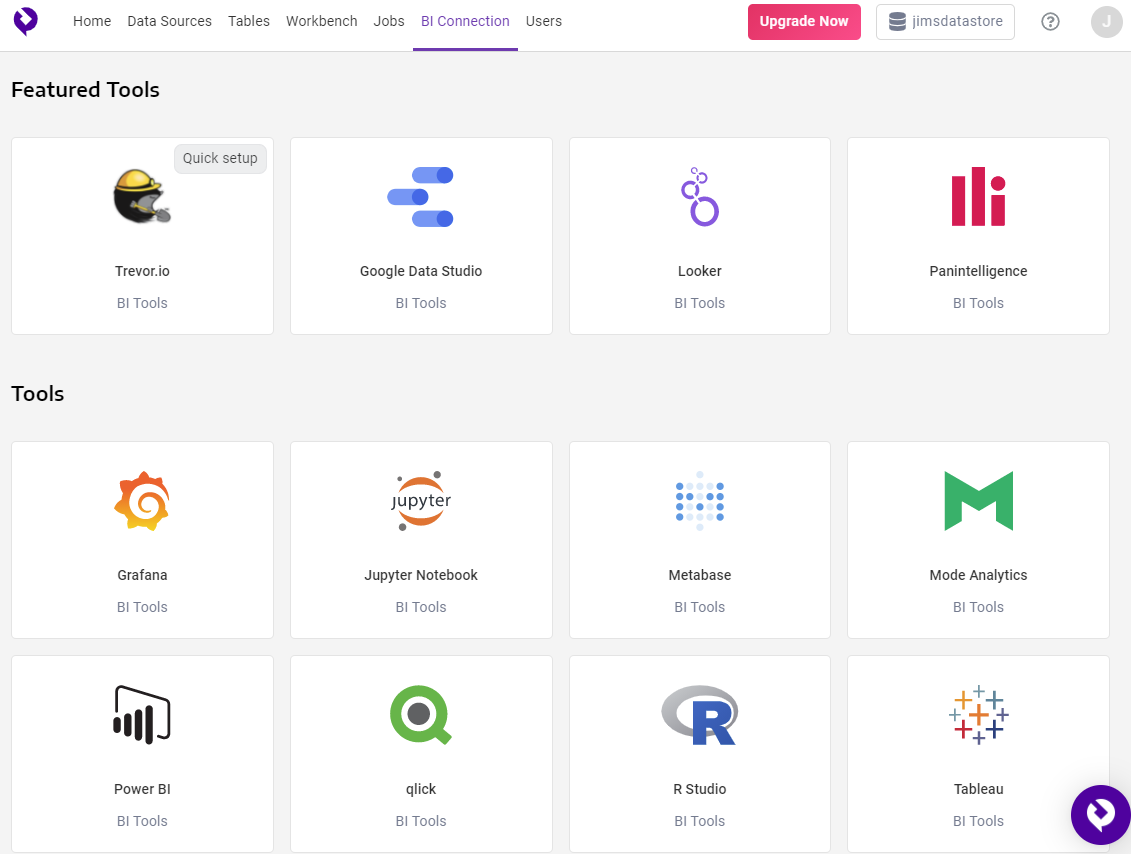
Panoply lets you connect directly to a range of BI tools that can help mine the gold that’s hidden among the numbers. You can see how effective your KPIs are and help motivate your team by giving them solid data on how their work helps the entire organization reach its goals.
4. Lead tracking
Most sales teams track customer data. Not all of them pass their data onto other departments after making the sale, however. Therefore, pulling sales information into a combined data store can provide value to your sales team, as well as your whole organization.
Google Sheets allows your sales team to track large amounts of customer data, working well as a simple customer relationship management tool.
Passing this data on and using it for analysis helps you learn more about your customers. For example, do customers that come to you via a particular channel stick around for longer? Perhaps some of them are power users. That’s all good to know as you target your sales and promotional efforts.
Getting long-term insight into which customers do what can help your sales team target those that best fit your business goals. As those customers have more value, you get a better return on your acquisition costs.
5. Customer Satisfaction Surveys from Google Forms
Customer satisfaction surveys are a great source of data, but not everyone takes full advantage of the data they provide. Instead of throwing it away when the survey is done, you can pull the information into your data warehouse to build a more detailed picture of your customers and their preferences.
Google Forms data can be sent to Google Sheets easily via its native integration. From there, you can pull the data into your data warehouse with Panoply.
If you then connect the survey data to customer information from other sources, you have a handy guide to their preferences, which could help your sales or customer support teams interact with customers more effectively.
6. Health care data
Google Sheets is an excellent place to store health care data, allowing contributions from different locations.
Medical professionals gather large amounts of information from their patients. Pooling resources and sharing this information can help develop new treatments and determine what is effective.
Piping this data to a single location has obvious benefits. You can compare data sets and look for general trends and differences between the information you have.
Again, you can also use Panoply’s filters to anonymize the data, protecting patient confidentiality.
Why use Panoply?
It's very easy to get started with Panoply—you can sign up and start in minutes.
From there, connecting to Google Sheets is as simple as finding the icon, clicking it, then picking your file, and activating the connection.
After that, you can do the same with other data sources or start using Panoply's analysis features.
I'll talk you through the first few steps; if you need more details, take a look at Panoply's documentation.
- Start with a free trial. There's no need to enter payment. Instead, you provide your email address, verify it, and then you're good to go.
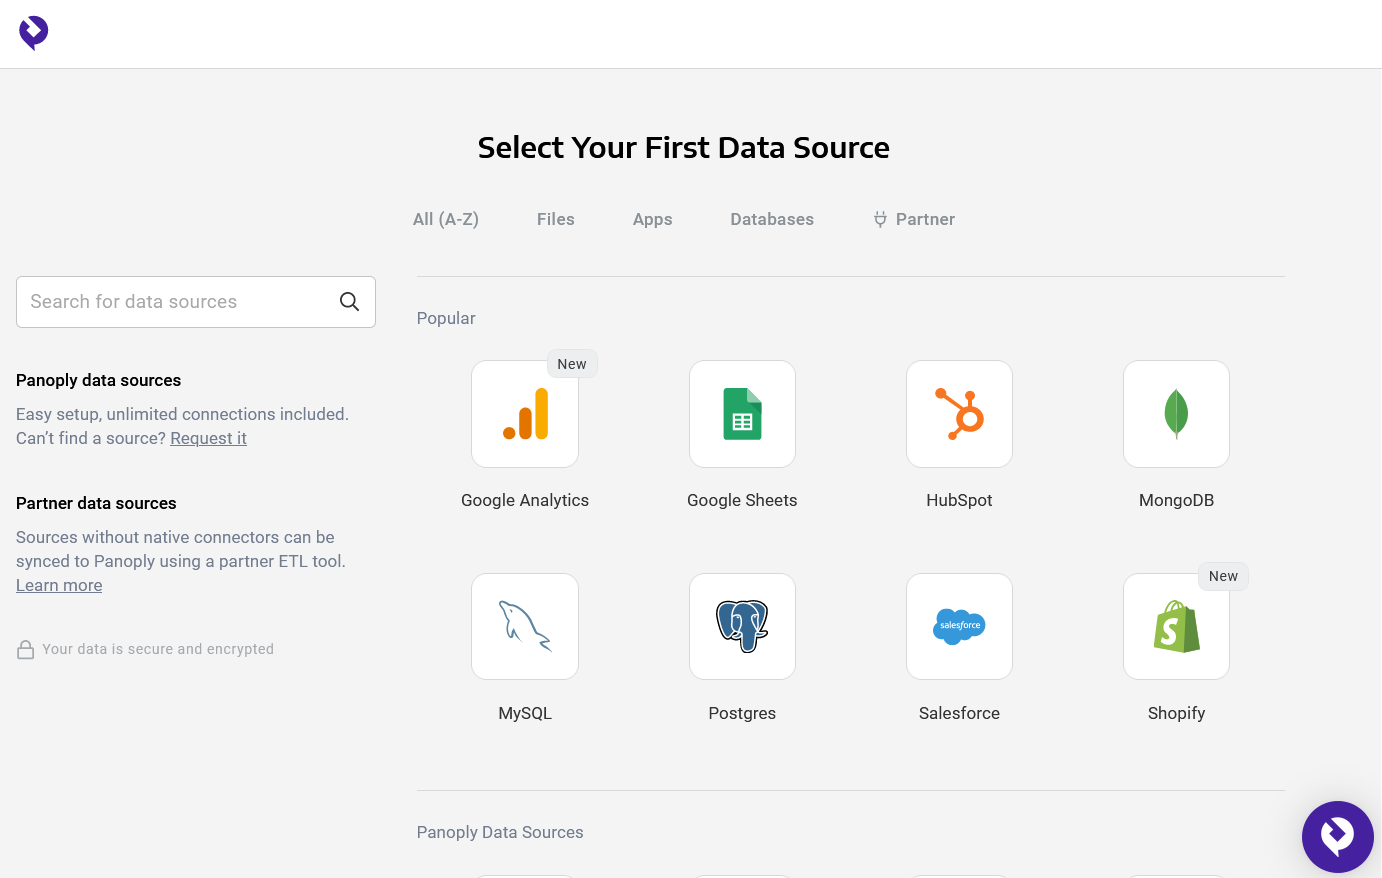
- Once you've done that, you're presented with an extensive list of data sources to import. It's easy to find and click Google Sheets.
- You then fill in your Google account details and pick a sheet to use.
- Finally, click the purple Collect Data button.
- The collection then takes place, and after a brief wait, you are free to view the results on the Tables page.
Conclusion
Google Sheets is an easy place for teams to put their data. It’s quick, accessible, and free. Of course, making the best use of that data takes a little more work, but with the right software, you can pipe it into a common data warehouse, where you can combine it with other sources from throughout your organization.
Panoply lets you do just that.
You can pull in data from a vast range of software and store it in a common data warehouse. From there, you can analyze it with any BI tool.
Your analysts can use it to build a detailed picture of your business and figure out how to improve it. Those changes can have a meaningful impact on your bottom line—the benefits of using data to its full potential are huge.


