The basic free Google Analytics (GA) functionality is great for small and medium websites and mobile applications, but as your online business expands, you will start looking to get more of this data. However, GA lacks advanced capabilities such as automated user segmentation, anomaly detection, and predictive modeling. That is why users are looking to integrate their GA within their data warehouses, for example, AWS Redshift. But can these be easily integrated?
Over the last few months I was in charge of creating our Google analytics extension here at Panoply.io that helps in loading, transforming and analyzing the data to our platform. As we developed this feature, we learned how to use GA custom dimensions, manually export the data using GA Reporting APIs, and finally get this data loaded from Google Analytics to Redshift.
This article provides step-by-step guidelines on how to extract and load data from Google Analytics to Amazon Redshift and use it for comprehensive web analytics.
For the purpose of illustration, I would like to check the number of pageviews per client, based on the source traffic country and corresponding network service provider. This will help us to determine which client is using what kind of network service providers, according to country, and how many pages have been viewed per network service provider or country.
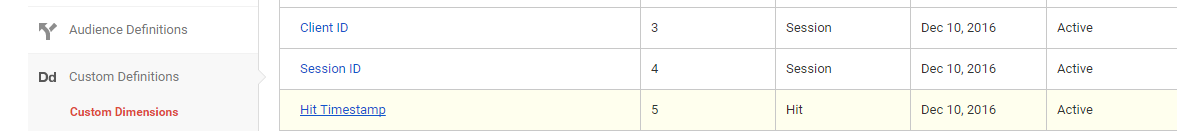
To show you how to do this, I have created three custom GA dimensions. First, I created two Session scope custom dimension names, Client ID and Session ID, as well as a hit scope custom dimension name, Hit Timestamp. The purpose of creating these custom dimensions is to generate session and hit scope data together, so we can assign Client IDs and Session IDs based on browser, along with a Hit Timestamp based on pageviews. We’ll then load the results of our queries to Redshift and combine them to generate detailed tracking of pageviews both by client and session.
Creating Custom Dimensions and Tags with Google Tag Manager
To create your custom dimension, sign into your GA account, then perform these steps:
- Set up some custom dimensions. For our example, create three custom dimensions named Client ID, Session ID, and Hit Timestamp. The first two dimensions are session-based, the last one is Hit-based.
- Next, sign into Google Tag Manager to tag the custom dimensions. The details are given in this article.
Once the custom dimensions are setup and defined tags using Google Tag Manager, it’s time to collect the data from GA.
Pulling the Data from GA
Pulling the data from GA is not a straightforward task. Although the Google Reporting API allows us to view metric values for a number of dimensions, it doesn’t provide any built-in dimension for incoming hit stream data. So here you can use a Python script, which will extract the raw data off GA and save it to a CSV file. You can obtain the Python code and full instructions here.
From our custom dimensions, you’ll create two different CSV files. For the Client ID custom dimension, customize the following lines in the Python script:
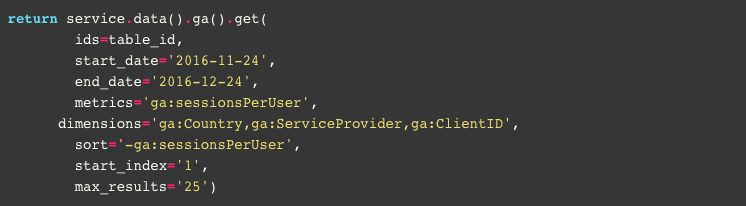
Then save the output to a CSV file named pageviews.csv.
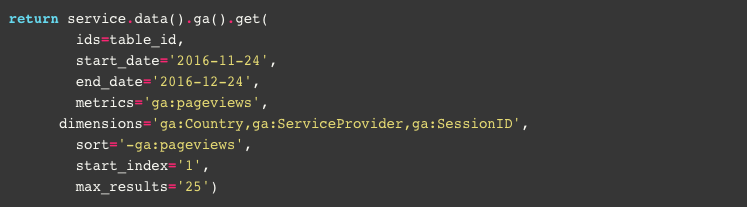
For our Session ID custom dimension, customize the following lines and save to a file called sessions.csv:
Next, upload these files to your S3 bucket and from there to Redshift.
Loading the Data to Redshift
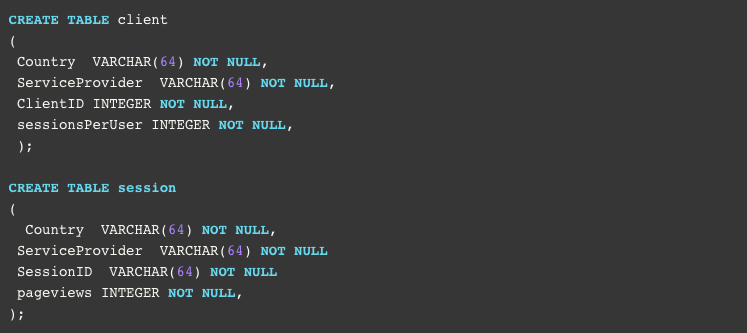
Before loading data directly into Amazon Redshift, it is important to decide how the raw data will be structured within Redshift. In our example, we issued the following SQL commands to create our clients and sessions tables:
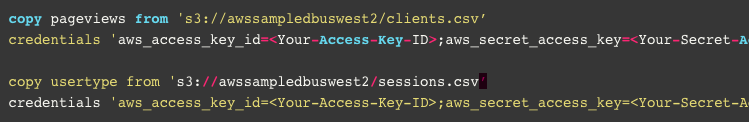
Next I copied the data from our S3 bucket into those tables. To do so, we executed the following commands:
Once the data has been copied to our tables in Redshift, I can execute, for example, a query to join the two tables into one:
![]()
Note: To keep the data up to date, a cron job should be set up to update the Redshift table at regular intervals.
I hope this article on loading data from Google Analytics to Redshift has helped you. I am already working on next week’s article, and continuing this example showing how to analyze the data loaded to Redshift using Tableau.


