As today’s number one CRM platform, Salesforce provides support to a variety of business processes within companies. With that in mind, you can only imagine the huge amounts of data stored in Salesforce databases. Used properly, that data can significantly improve your organization.
But how do you centralize all that data in an efficient manner? And how do you create useful insights out of it? The answer is very simple: by using a data warehouse with your Salesforce data.
Even though you might not be aware of it, as a Salesforce user you probably have many reasons to use a data warehouse in your everyday work. For example, you may want to easily integrate your Salesforce data with data generated through some other application(s). Or you just want to perform deeper analysis of your Salesforce data that isn't provided by default and is complicated to accomplish in Salesforce.
We'll walk you through Salesforce's data model and how Panoply's automatic schema detection and key creation makes managing your SFDC data so much easier. If you'd like to skip around, just click on one of the sections below:
- Before we begin: What is nested data?
- Salesforce's data model
- How Panoply tables work
- Joining Panoply tables
- Mapping data from Salesforce to Panoply
- Setting yourself up for long-term success
Before we begin: What is nested data?
Before we get to the specifics of Salesforce and Panoply, we need to explain nested data. Nested data structures are hierarchically organized structures that have at least two levels of data and contain a parent-child relationship between the objects. Each element of a structure is either a parent or a child—or both, in case we’re talking about multilevel nested data structures.
The Salesforce data model is based on a nested data structure. Panoply, on the other hand, transforms this nested data structure into a flat relational model when collecting data. The reason behind these transformations is that Salesforce APIs return JSON which must be flattened for the data to be stored in Panoply tables for easier querying. Let's take a deeper look at how this works.
Salesforce's data model
To understand how Salesforce structures data, let’s explore the Salesforce Sales Leads API.
Step 1. The figure below displays the default Sales Leads API. This API displays a list of the Leads in the system.
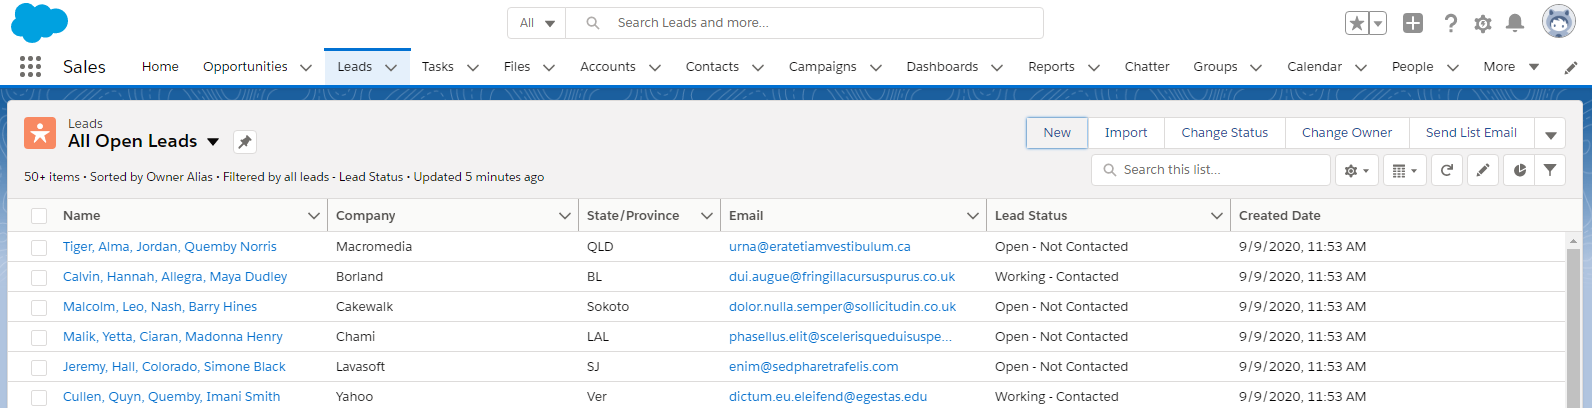
Step 2. If you want to see the full structure of the Salesforce Leads data group, click on the New button in the upper-right corner: the form with all Leads fields will open.
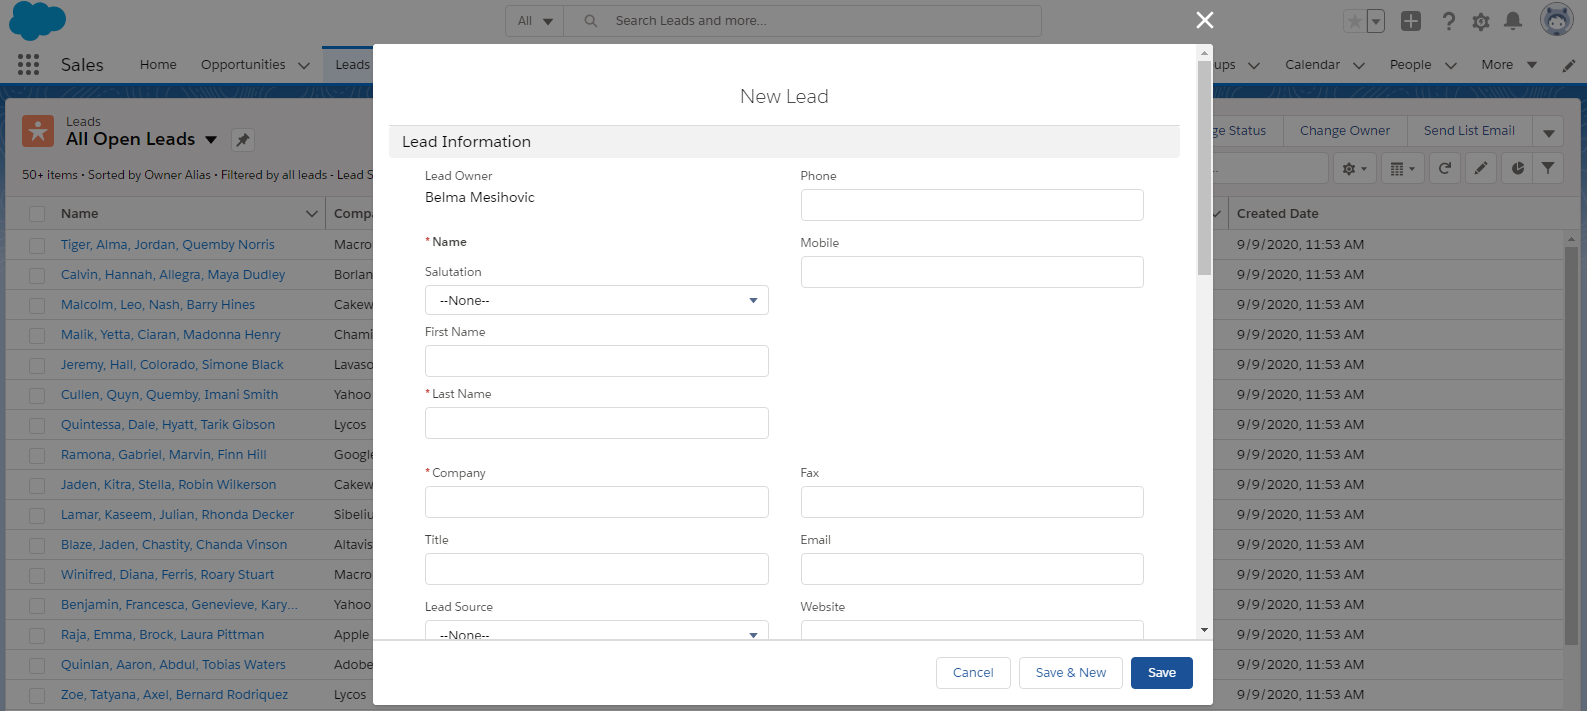
Step 3. Scroll through the form: you’ll notice that the data group consists of a parent and a child level nested data structures. Now, don’t be fooled by the way the data is grouped on the form. Sometimes UI designers visually separate particular data fields even though they belong to the same level of the nested data structure. This is exactly the case with the Additional Information and Description Information sections here.
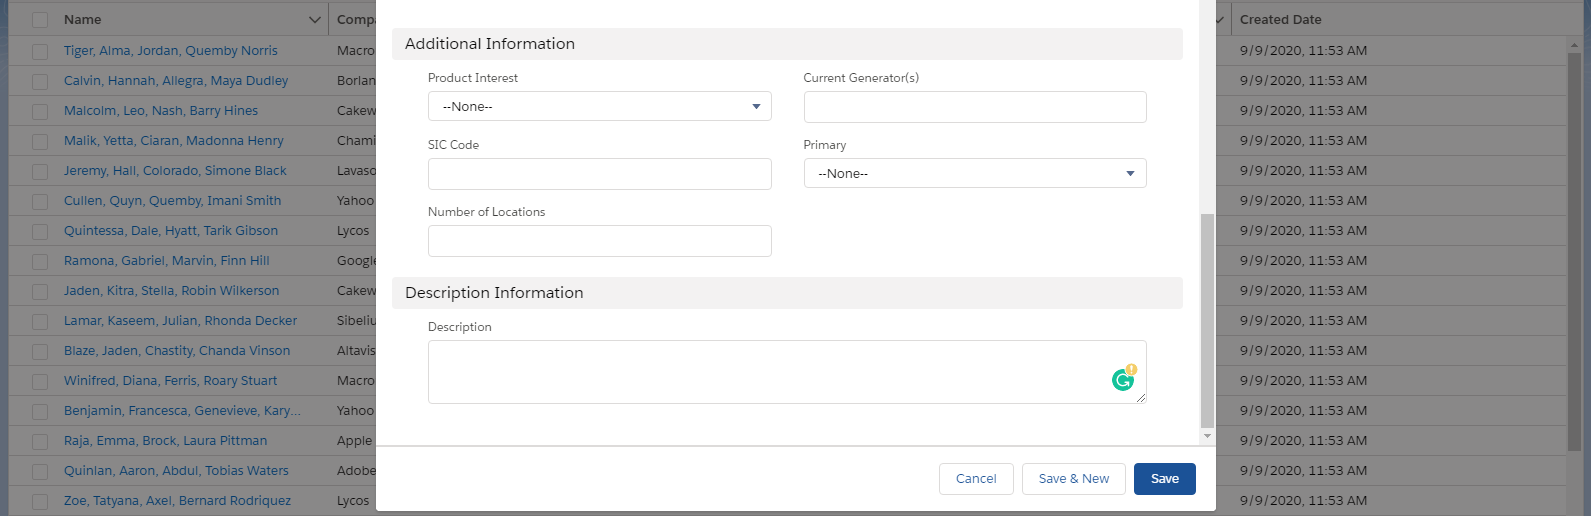
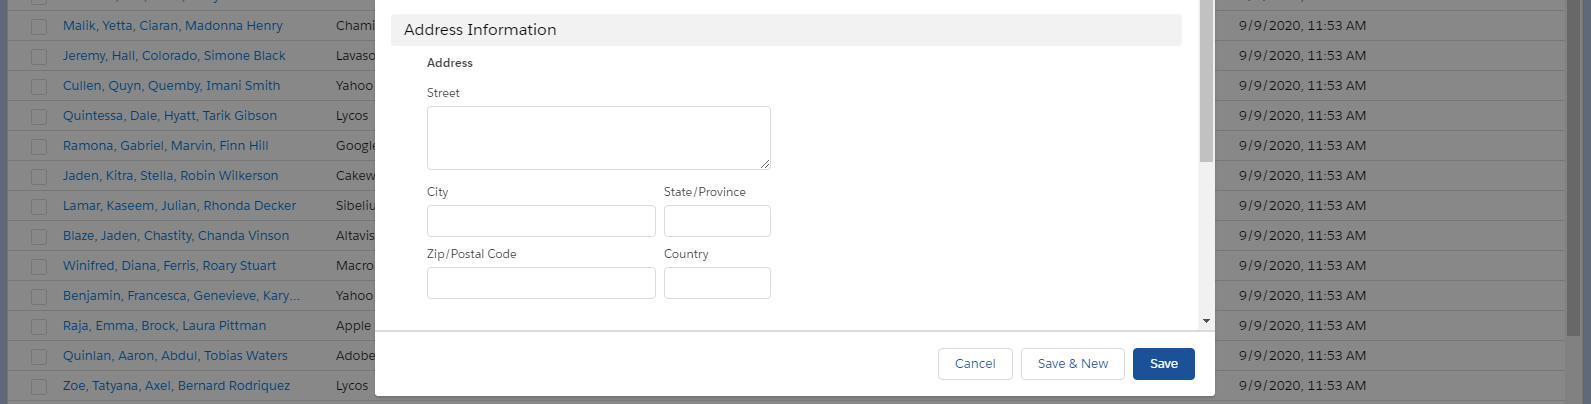
However, the Address Information section is child-level nested data:
Step 4. Your data from the Salesforce Leads API has a nested data structure like this:
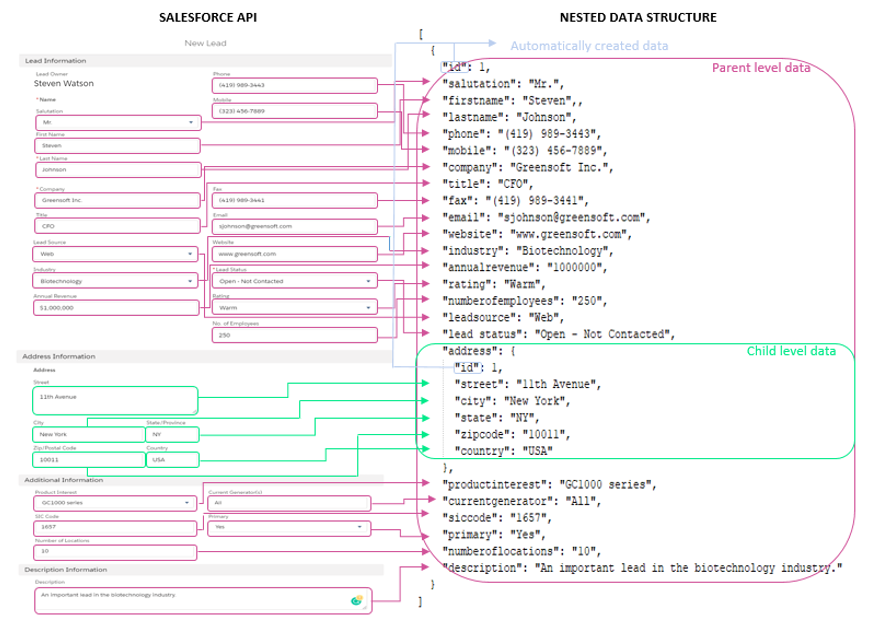
Keep this figure in your mind: it will serve as the starting point in the Salesforce to Panoply data transformation process.
How Panoply tables work
Your data exploration journey in Panoply starts with the Tables tab:

Here you can preview all the tables generated by Panoply during the data collection process:
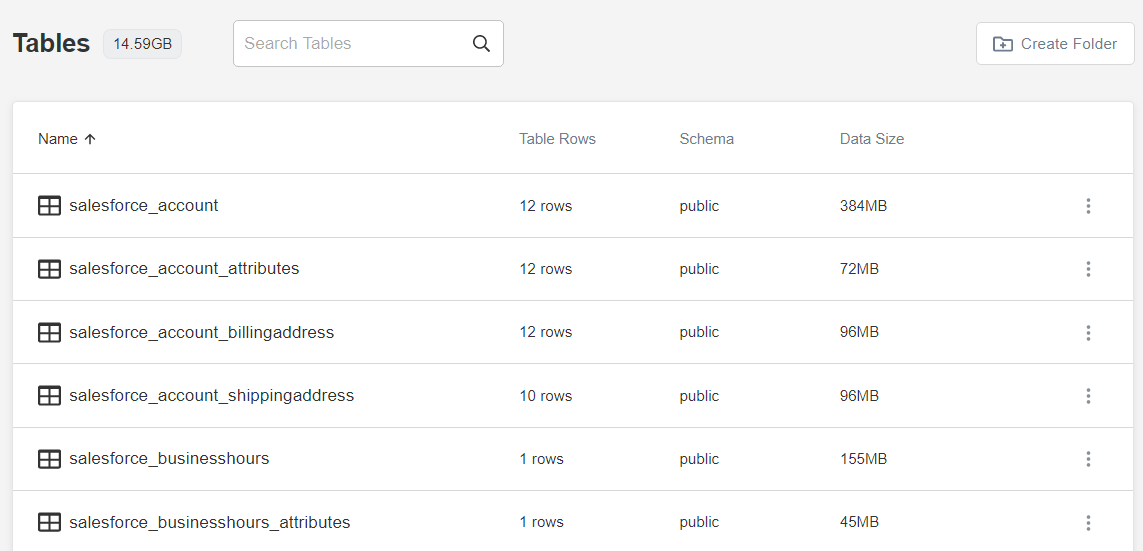
As you can see, Panoply generates a lot of tables. To find the data you need, it's important to understand that Panoply generates 26 logical data groups from your Salesforce data. For simplicity's sake we'll focus on just a few of them, but know that there's a whole lot more data available.
.png)
The Salesforce nested data model is critical to understand what's going on at this point: Panoply uses it as a starting point to create two different types of tables that make up its flat relational model: parent and child tables. Each logical group contains one parent and at least one child table. In the example above, we've included two child tables: User Role and Opp History.
To better distinguish between table types, let's take a look at how Panoply names tables.
Panoply table naming conventions
Panoply uses a very clear and consistent naming convention that uses data source name and nested data for the creation of table objects.
The name of the table is defined as follows:
[data_source_name]_[parent_group_name]_[child_name]
Let’s see what that looks like with Salesforce.
Step 1. In this case, data source name is Salesforce, so all the tables will have salesforce as the prefix.
data_source_name = salesforce
Step 2. If you know the names of the data groups created in Panoply, you’ll be able to identify the parent tables easily. Just put the data group name in place of the parent_group_name attribute, and you’ll get the names of the parent tables.
Here are some examples:
salesforce_accountsalesforce_businesshourssalesforce_groupsalesforce_lead
Note: If the data group name consists of multiple words with spaces between them, they'll be concatenated into one word. For example, if the group name is Business Hours, the parent_group_name attribute would be businesshours.
Step 3. All tables that are not listed in the previous step are child tables. Visually, they can be easily connected with their parent tables based on the same data source and parent group name.
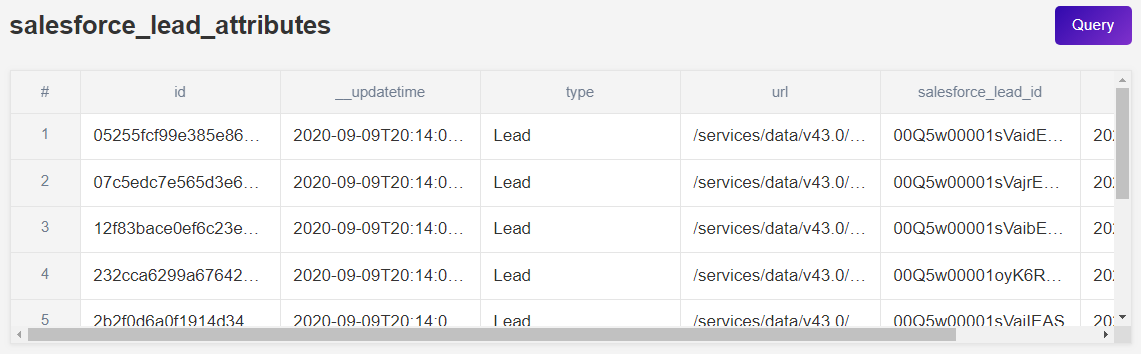
As an illustration, if you want to identify all the child tables that are related to Leads, you need to look for the tables with names that contain the word lead. Let’s take a look at what you’ll find if you search for "lead":
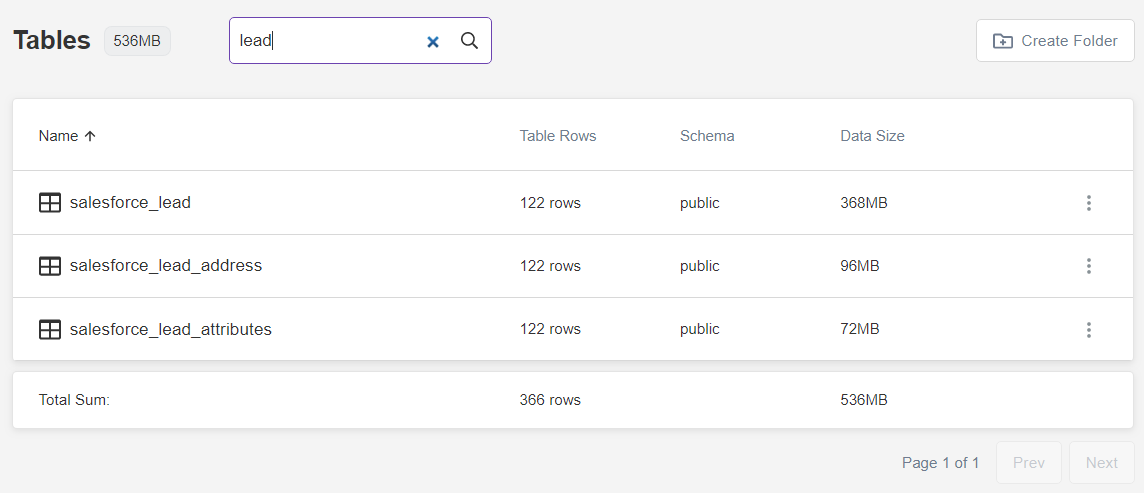
Looking at the above example, salesforce_lead table is the parent table. The other two tables are child tables: salesforce_lead_address and salesforce_lead_attributes.
Panoply table structure
There are plenty of ETL tools for Salesforce data. But when Panoply's native integration loads your SFDC data into your warehouse, it automatically create tables based on certain rules. Understanding these rules is essential for quick and effective data analysis.
What does parent table structure look like?
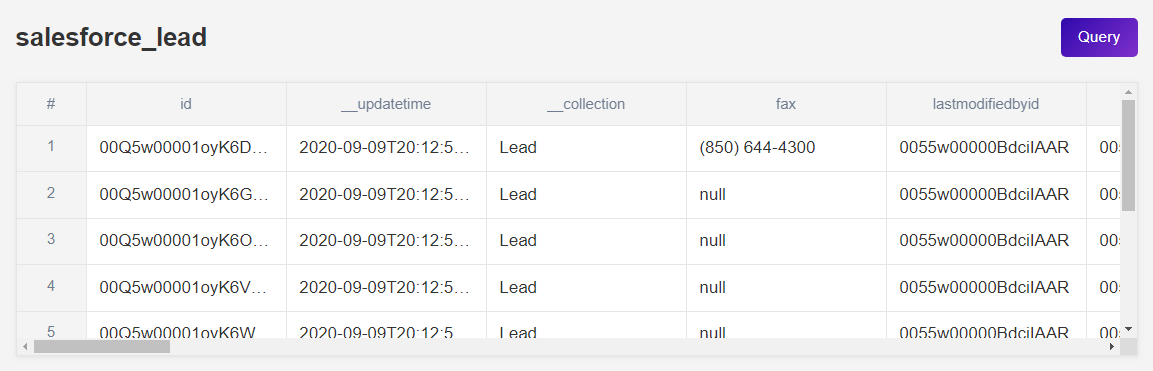
First off, Panoply automatically generates a key for each table it creates. The key column is always named the same: id. During data ingestion, other columns are automatically created as well. These columns are typical metadata columns, and they are generated in all tables (not just in parent tables). However, they don’t contain metadata about the table data, but about the resource from which the table was created, as well as the data transaction process. You can easily distinguish them from other table columns because their name starts with “__”.
Each parent table of a particular logical data group contains the same four metadata columns:
updatetimecollectionlatestdatecoveredsenttime
Another thing to notice about parent tables is that they also contain columns which have the “__c” suffix included in their names. Columns that have the “__c” suffix in their names are custom fields that reside in the Additional Information section in Salesforce API form.
| Fields in Salesforce Sales Leads API | Column names in Panoply lead parent table |
| Product Interest | productinterest__c |
| SIC Code | siccode__c |
| Number of Locations | numberoflocations__c |
| Current Generator(s) | currentgenerators__c |
| Primary | primary__c |
What about child table structure?
Panoply automatically creates at least one child table per data group. This table has the same structure in all data groups and can be recognized by the “__attributes” suffix. For example, the salesforce_lead_attributes table holds basic attributes of the Leads data stored in Panoply. Besides updatetime and senttime metadata columns, this table also contains the following fields:
idtypeurl- salesforce_parentgroupname_id (in this example, parentgroupname = lead)
Many Panoply data groups contain only one child table. However, for some data groups Panoply generates another child table with the “__address” suffix.
The only data group that has three child tables is the Contact data group. This group contains two child tables that hold two types of addresses: mailing (salesforce_contact_mailingaddress) and other addresses (salesforce_contact_otheraddress).
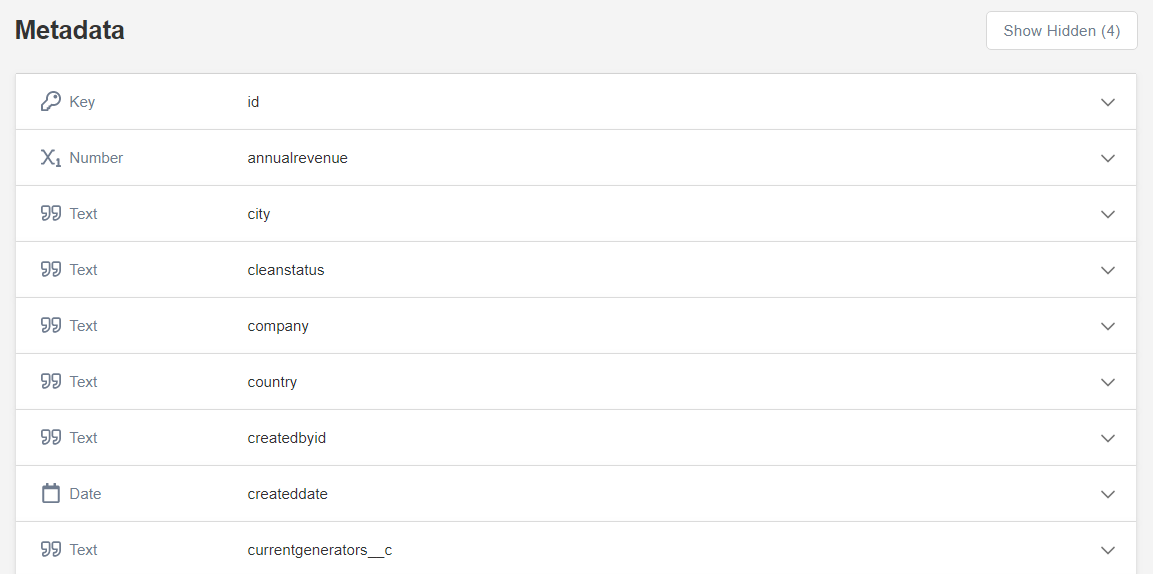
Metadata across Panoply
All Panoply tables include a Metadata section that provides additional information on a table column. On the left side of the column name, you’ll notice the information about the column type. The exception is the id column: you don’t see its type, but only the information that it is a key column. By default, metadata columns whose names begin with “__” are hidden: you can see them if you click on Show Hidden at the top right.
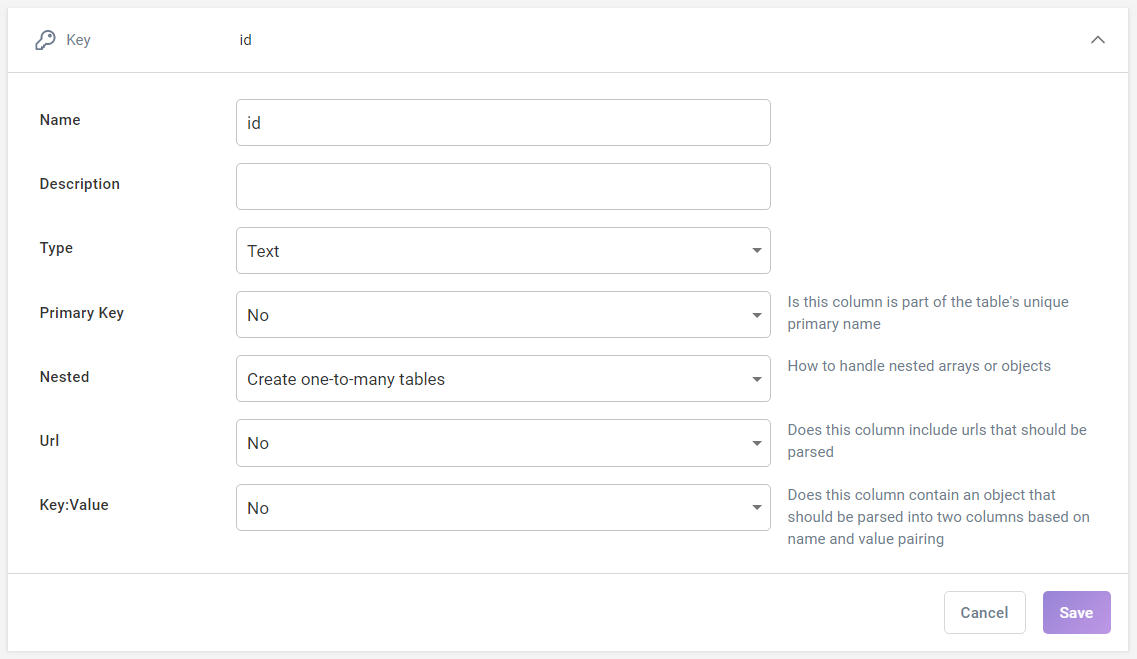
Click the carat on the far right of each row to expand a particular metadata field and explore its details. The same properties are collected for all table columns, and they're pretty self-explanatory, so it’s easy to understand what they represent.
Joining Panoply tables
You’ve already noticed that Panoply generates at least two tables per one logical data group. For example, take a look at the Leads data group structure. This group contains the following tables:
salesforce_lead, a parent tablesalesforce_lead_addressandsalesforce_lead_attributes, child tables
When doing analysis, you would probably join child and parent tables in order to get the data from the child table, right? That's easy because there's a relationship between parent and child tables in Panoply based on those automatically created keys.
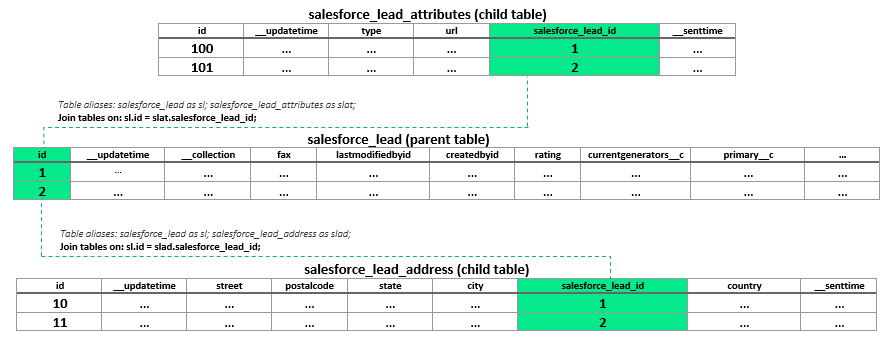
But let's take a closer look at the salesforce_lead_address and salesforce_lead tables: all the columns from the child table also exist in the parent table.
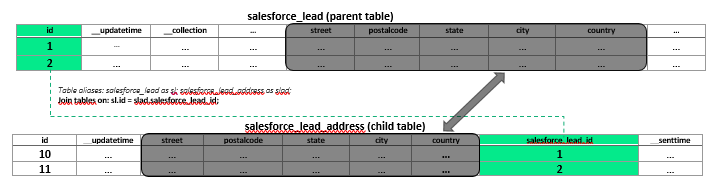
That's not a common situation for a normalized relational model, right? So why is there duplicate data? The answer lies in how you—or your Salesforce administrator—has set up your SFDC account.
If your Salesforce admin is incredibly meticulous, they might take care to ensure that no data is duplicated across objects. However, because Salesforce gives you a lot of freedom around object properties, 1) it's easy to accidentally end up with duplicate data and 2) it may make sense to have data appear in different places.
For example, let's say your Marketing team is creating geo-targeted ads. They may be interested in city, state, and country, for your current prospects but they may not need the street address. In contrast, the full address is crucial to your Billing department, as it's important for their records...and tracking down troublesome payments.
The flexibility of Salesforce's data model means you can associate some or all of those fields with the objects that are most relevant to the department that uses them, which might be Leads for Marketing and Accounts for Billing. And because Panoply automatically detects the schema you've set up, it ingests the data as you've structured it rather than imposing some external logic you may not want.
But there's another benefit to this kind of duplicate data: Having the data in multiple places can speed up query processing by reducing the number of tables and minimizing the need for expensive table joins. While you can largely focus on parent tables in your analysis, querying child tables will be more cost-effective because the child table is much smaller than the parent table, your query response time will be faster.
Now, let’s see how to perform a join on parent tables. Basically, the relationship between those tables is based on keys, as in any relational model. To enable joins, Panoply automatically identifies interconnect data groups and creates columns within each parent table that act like keys: they contain the same value as the primary key column of another parent table. In the example below, we’ll join two tables called salesforce_lead and salesforce_user based on a user id:
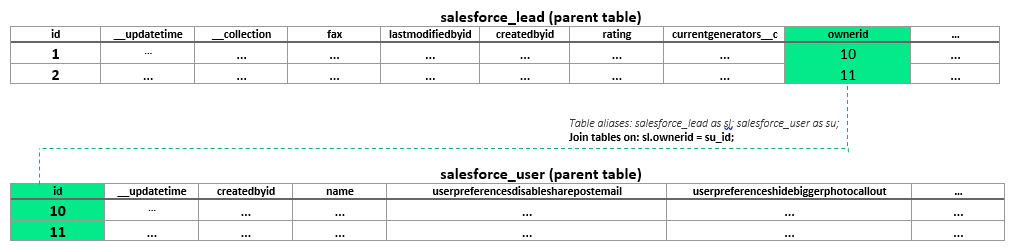
Here is one quite simple example of making joins on two parent tables. Let’s say you want to count the leads per team member and lead status. The following script applies the query that gives the result:
SELECT
	u.name AS lead_OWNER,
	l.status AS lead_status,
	count(1) AS total
FROM
	salesforce_lead l
	JOIN salesforce_user u ON l.ownerid = u.id
GROUP BY
	lead_owner,
	lead_status
ORDER BY 1, 2 DESC
Once you’ve figured out the tables’ structure and how they are linked to each other, you're ready to start manipulating the data in your tables.
Mapping data from Salesforce to Panoply
Remember the figure from the beginning that shows how Salesforce organizes its data? Let’s start from there and see how that data is mapped into the Panoply data warehouse. For easier understanding, the starting point will be the Salesforce Sales Leads API.
This is how the Salesforce-to-Panoply mapping process looks:
.png?width=768&name=Untitled%20presentation%20(1).png)
As you can see, various types of columns reside in Panoply tables. Let’s group them for a better understanding of Panoply's architecture:
- Blue: Columns automatically created during the data ingestion process, including metadata columns. They aren't in the Salesforce API, but Panoply creates and stores them in its data warehouse.
- Purple: A column automatically populated by a key value from another table. Here, the column is named
ownerid: this column is populated based on the owner’s name that resides in the Salesforce API. - Pink: Columns that are directly mapped from the Salesforce API to the Panoply table.
Setting yourself up for long term success
When you're trying to find a competitive edge, it's essential to go beyond stock Salesforce reports and really dig into your sales and CRM data. The problem for many companies, though, is that wrangling SFDC data feels like an impossible task.
That's where a platform like Panoply can make that chore a whole lot easier. Features like automatic key creation and automated schema detection make it a lot easier to work with your data...and set you up to find interesting insights now and well into the future.


