This tutorial was authored by Ahmed Shaaban, a MeasureMatch partner.
In this tutorial we are going to walk through:
- Creating a Panoply account, creating an online MySQL database
- Creating a MySQL table and filling it with dummy data
- Installing and using a local IDE for using MySQL
- Configuring the JDBC drivers for MySQL and Redshift
- Connecting MySQL to Panoply
- Create your first job to load data from MySQL to Panoply
- Querying data in the Redshift from the Panoply workbench and from the Local workbench
- Connect Panoply Redshift to Tableau and create basic dashboard
- Check the data on the source and on Redshift and on Tableau.
Isn't MySQL enough? Why do I need to replicate data?
This is a big debate in any business environment: why do I need to replicate my MySQL data?
First, because MySQL is designed to be an application database. Although it supports most analytical functions, MySQL is a row-based database and it is meant to serve the software requirements specifications (SRS).
Second, MySQL doesn't support the horizontal scalability to deliver wide columnar analytics and make very deep historical analytics possible. Therefore, in some sense, it is similar to Xero Analytics in the sense that as your business grows, you will need to onboard other tools that complement it to suit the growing needs of your company.
Creating a Panoply account
To get started, sign up for a Panoply account (if you don’t already have one), then sign in after checking the confirmation email.
Creating a Panoply database
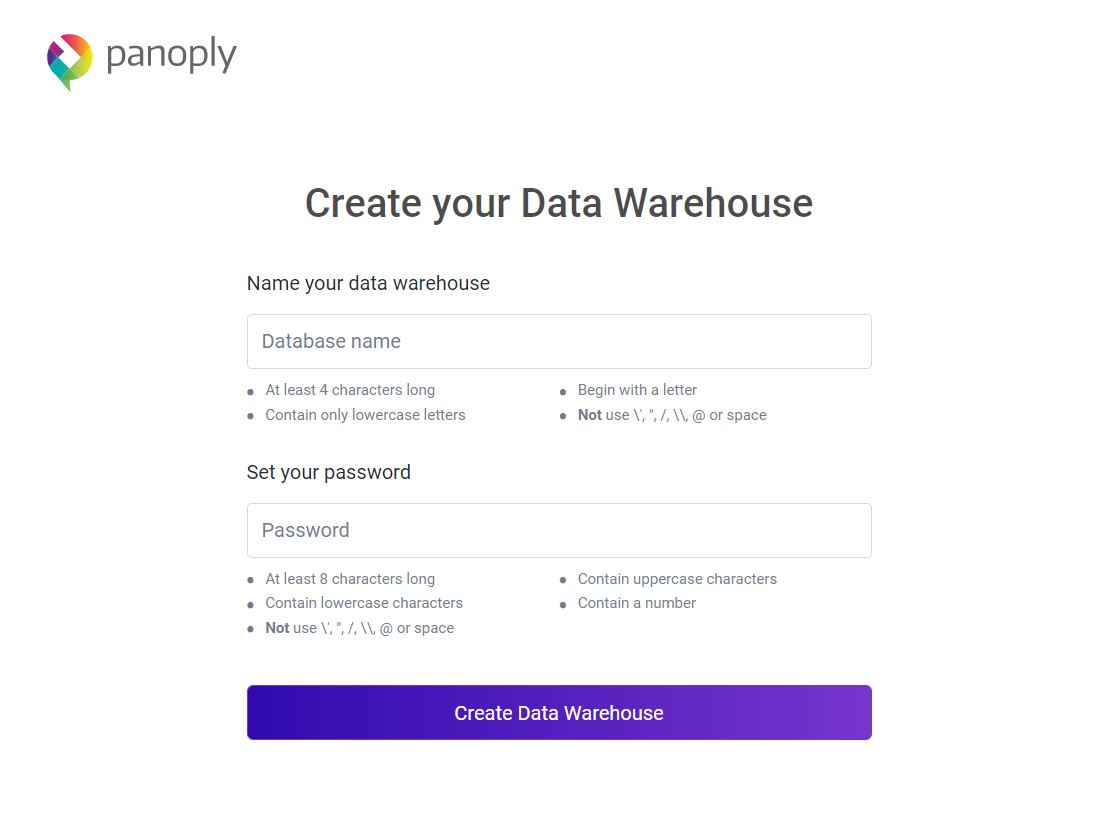
Creating a MySQL database
First, we’ll set up a new MySQL database. For the purposes of this tutorial, we can just use a free MySQL hosting service.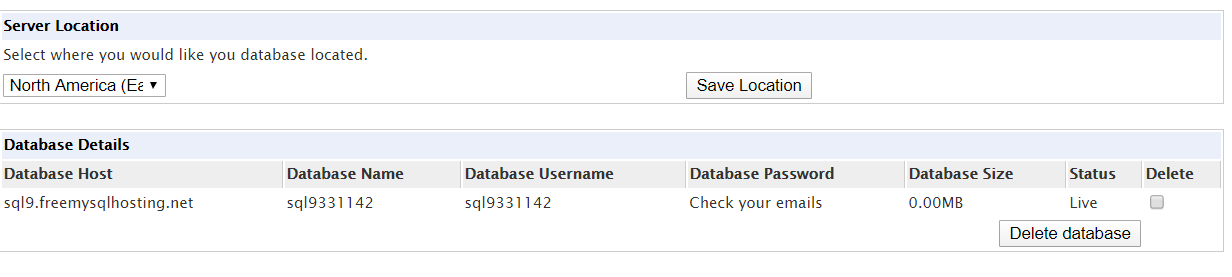
The website will send you the password on your email, and you may need to check your junk folder.
Download workbench
Next, we’ll want a workbench on our local machine to make working with our new MySQL database easier. Try this one if you don’t already have a favorite.
Extract and then run the installer.
MySQL JDBC Driver
Next, you’ll need to configure your SQL workbench so that it can connect using the JDBC driver. Download, then open the SQL workbench, choose Manage drivers, and then choose the location of your MySQL Driver.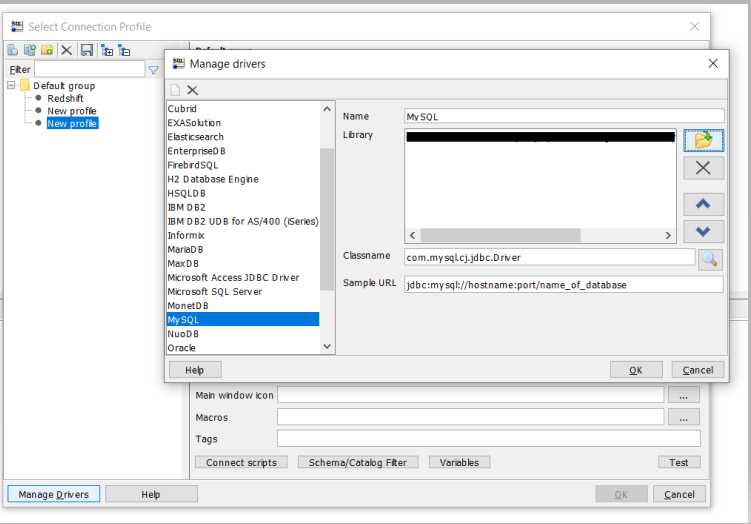
Next, configure the new connection as below: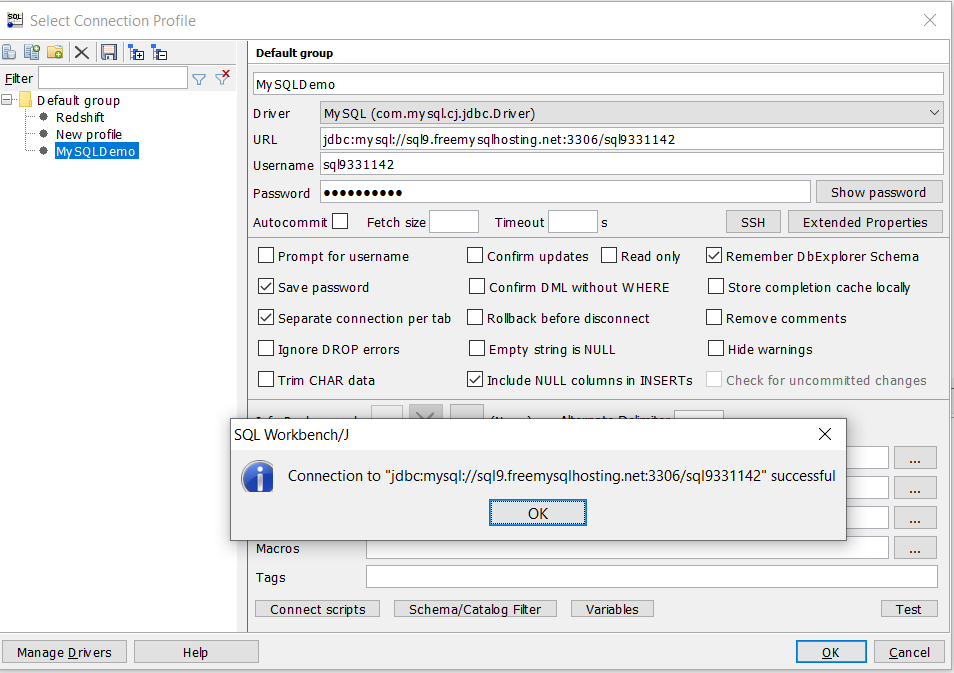
Now go to the BI connection portal on your Panoply account and get the connection details for Panoply. This will allow you to use your SQL workbench with Panoply.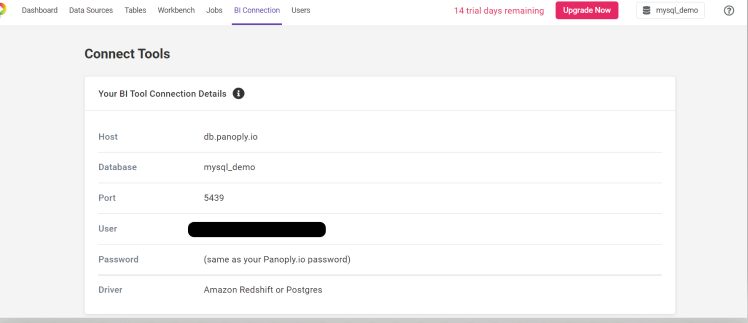
Download the Redshift JDBC driver
In order to make the workbench work with Panoply, though, you’ll need to make sure you have the Redshift JDBC driver installed. You can find it here.
Go to manage drivers in your workbench client and enable Amazon Redshift.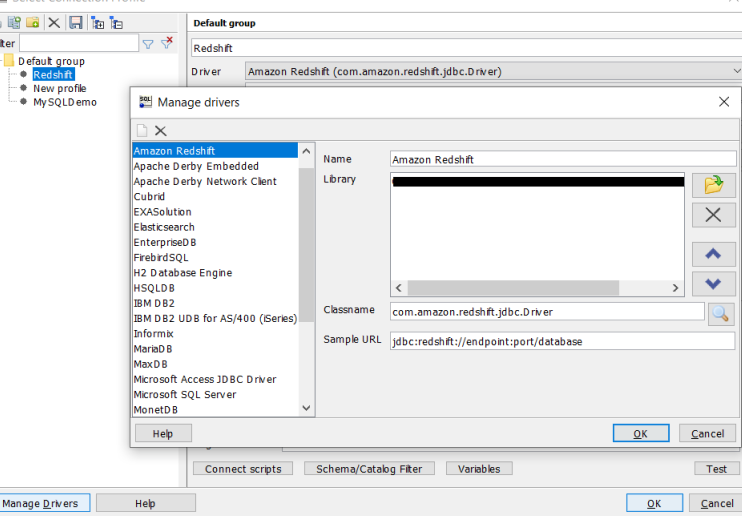
Then enter the credentials you gathered from the BI connection portal above and test.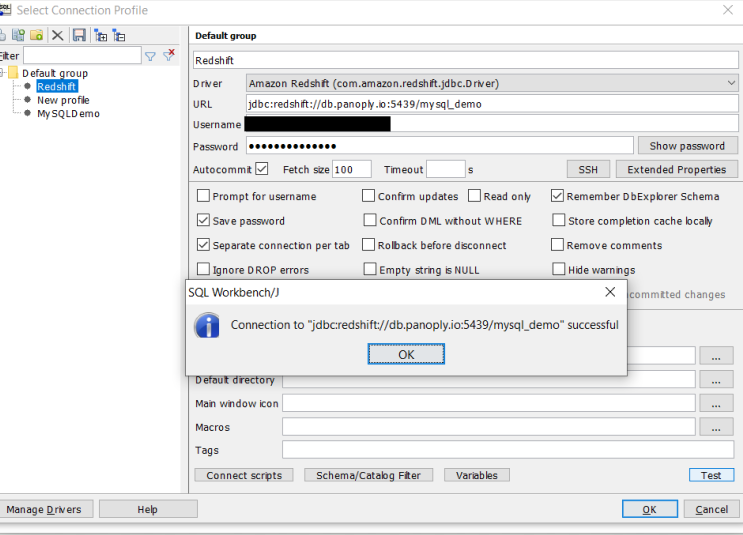
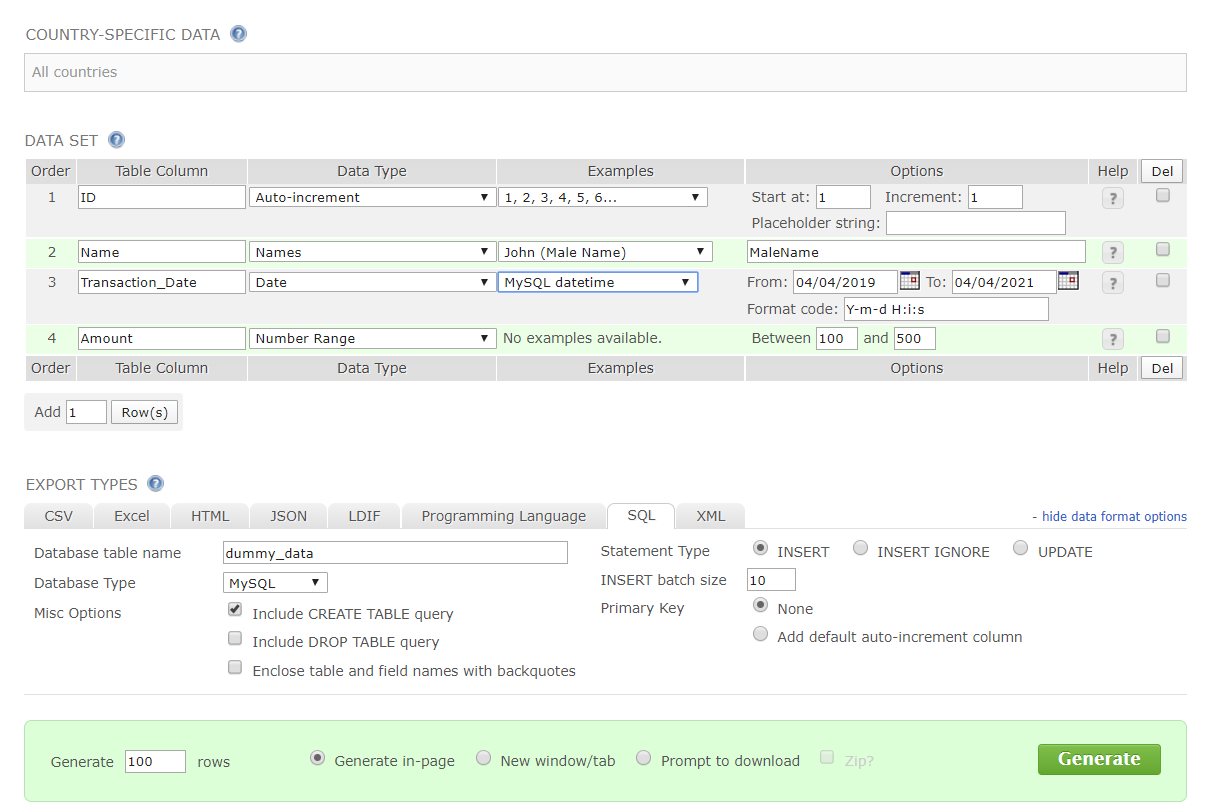
Generate dummy data for MySQL
Now let’s put some data in our new MySQL database. Since we’re just doing a quick tutorial, we can just generate dummy data for the purposes of setting things up. This site has a nice interface, and lets you generate a table creation and loading statement with dummy data right in the browser.
 Then go back to the SQL workbench and point to your MySQL connection.
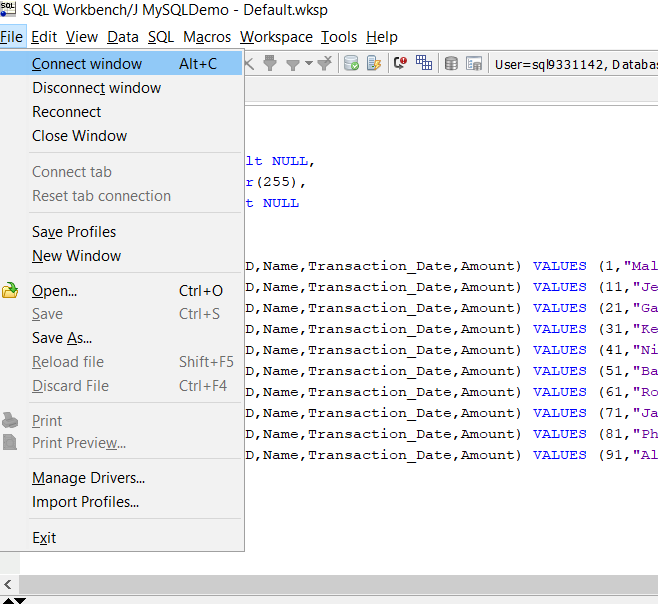
Paste the SQL statement from the dummy data website directly into your query field and run.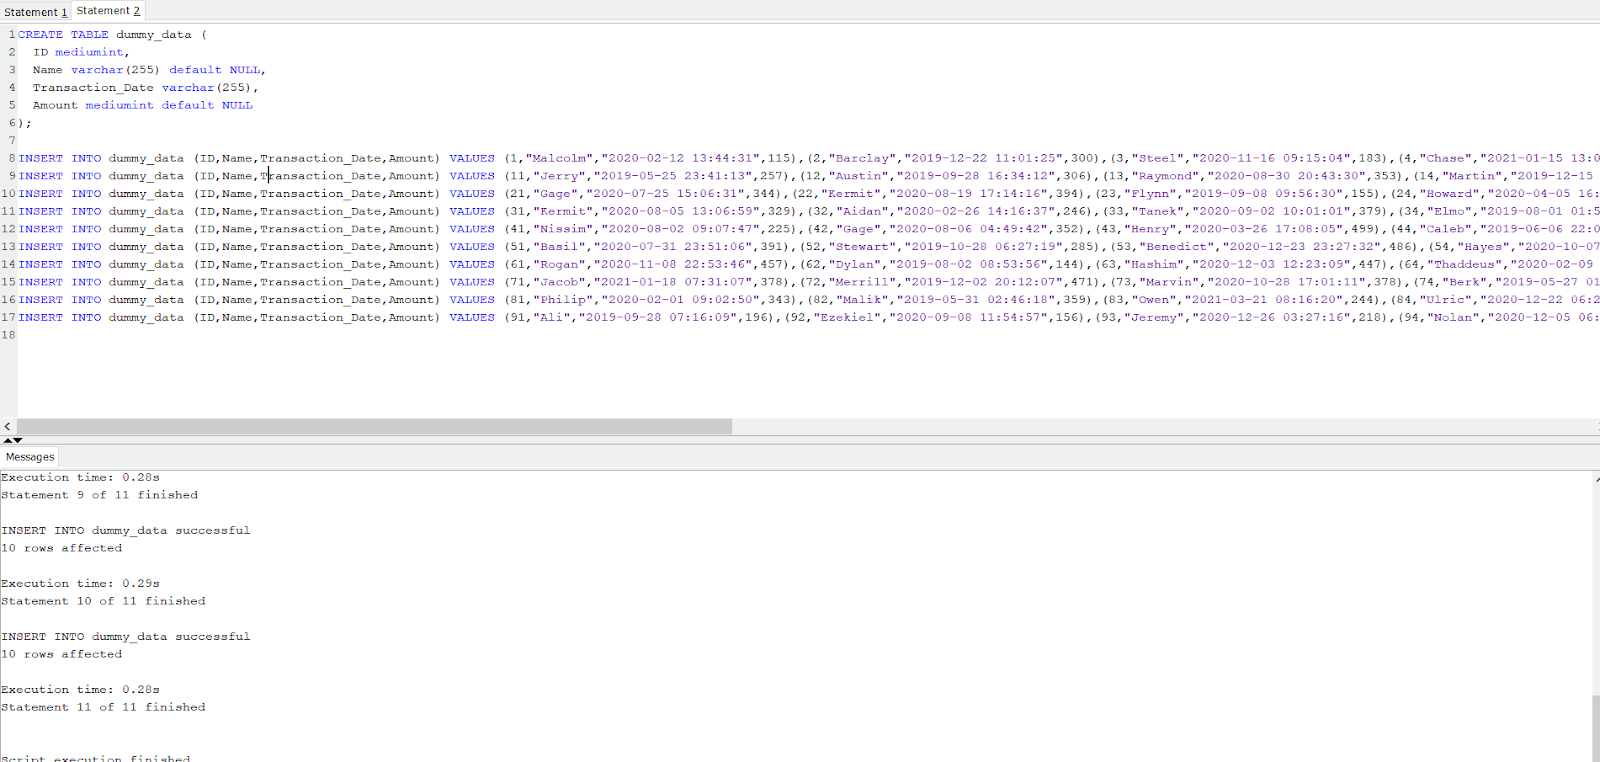
Now, let’s load that data into Panoply. Head to your Panoply dashboard and select Data Sources. Choose MySQL. You’ll need the same connection details you used for setting up your workbench’s connection to your MySQL database.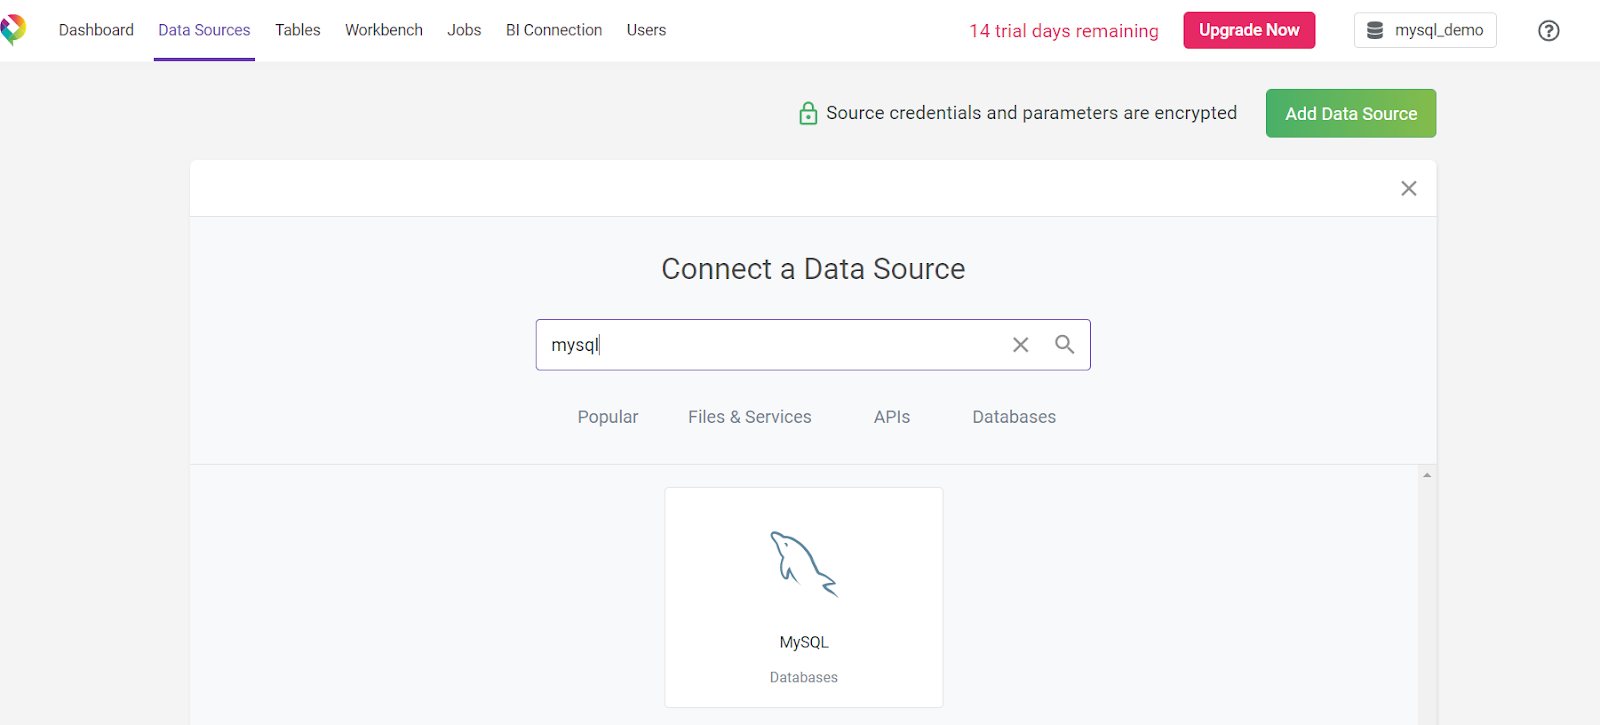
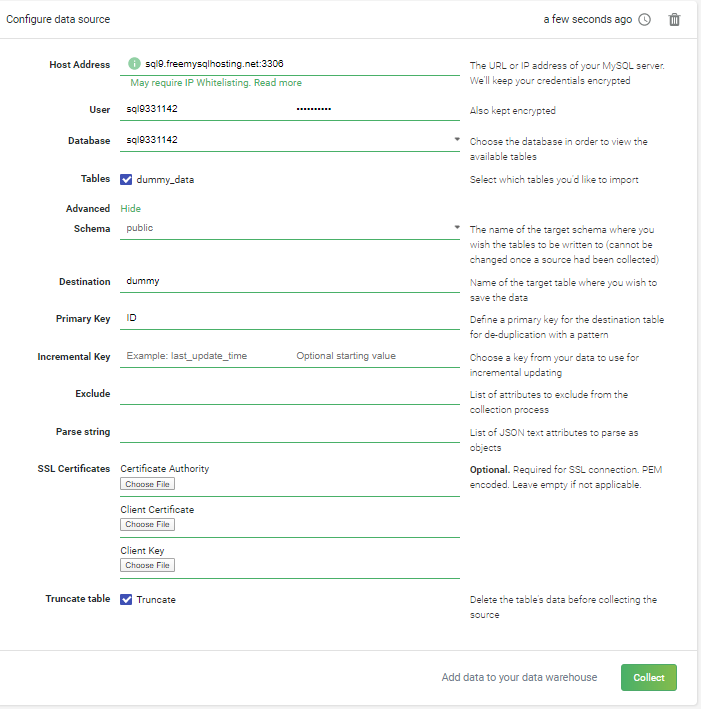
Configure MySQL data loading
A pane with database configuration options will appear. You’ll be able to choose some advanced parameters that you may discard for ease, like the destination table where you can customize the target table name, choose the primary key to avoid duplication in any future load in the target table, and set up the incremental key where it can be used in delta loads of transactional data. One thing you won’t need to do, though, is create your own database schema. Panoply will generate a new Redshift schema for you automatically.
Choose load frequency
In the next pane, you can choose the frequency of how this data needs to be collected. You can schedule this job in hourly intervals, or at specific time of day, or just do one ad hoc collection run. Also note that once you schedule a collection, the job will be put in the Panoply backend queue to execute.
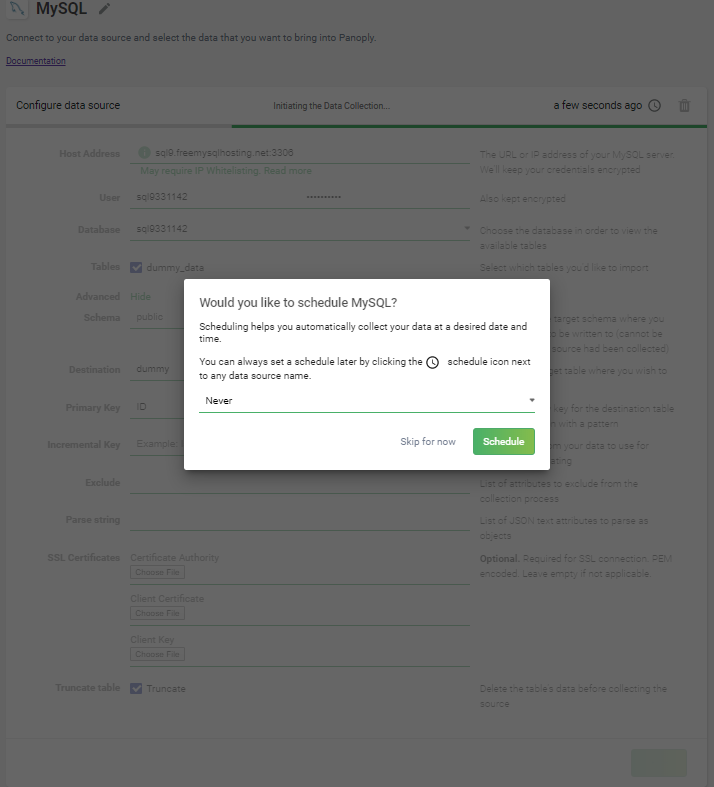
Then click schedule to collect.
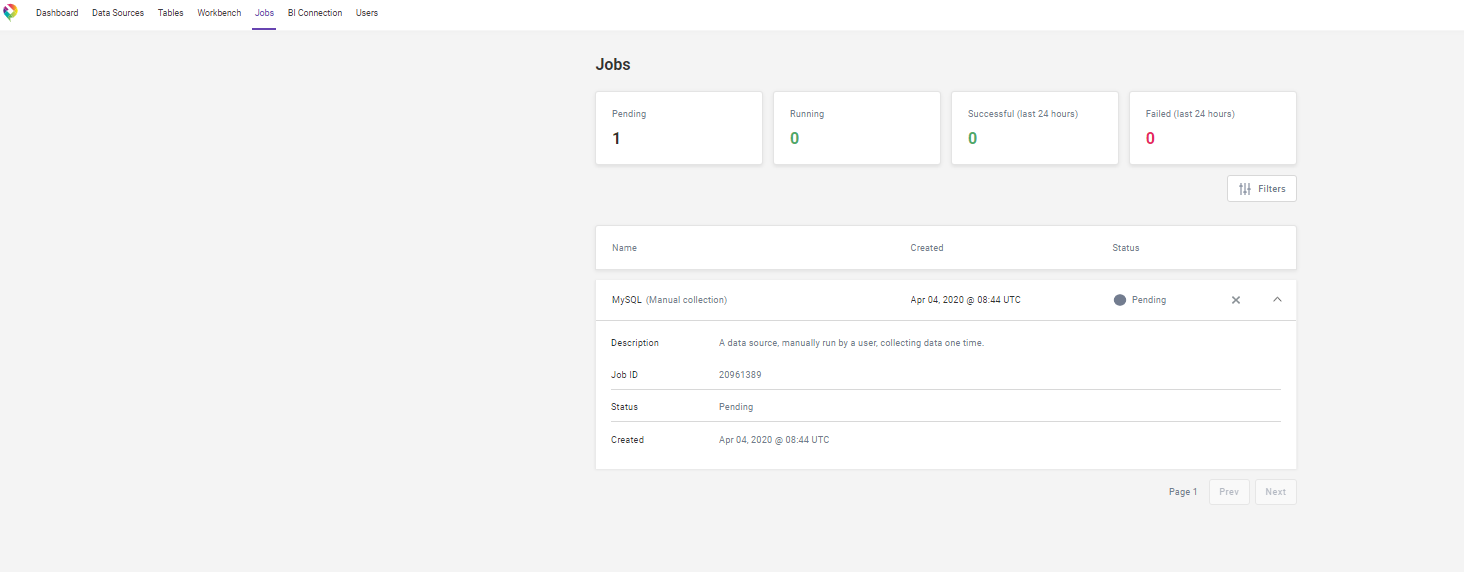
You can monitor all data collection processes in the Jobs pane. If you go there immediately after scheduling your MySQL collection, you should see the job listed as as pending.
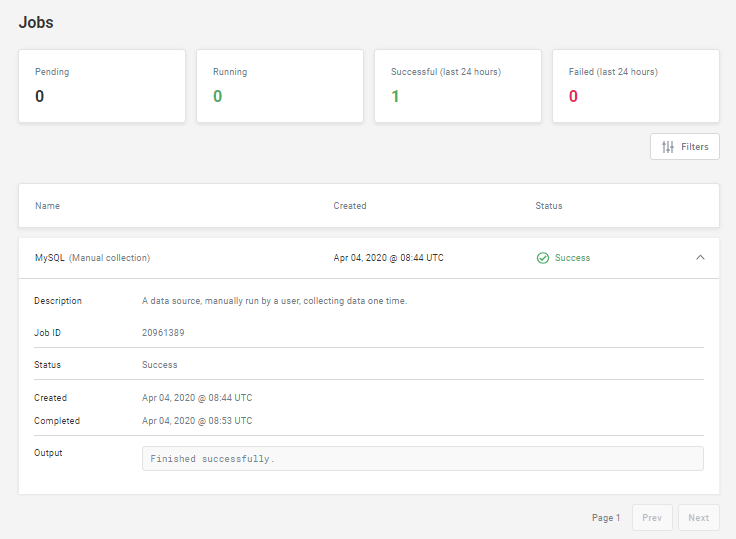
Once the job is successful, you should see something more like this:
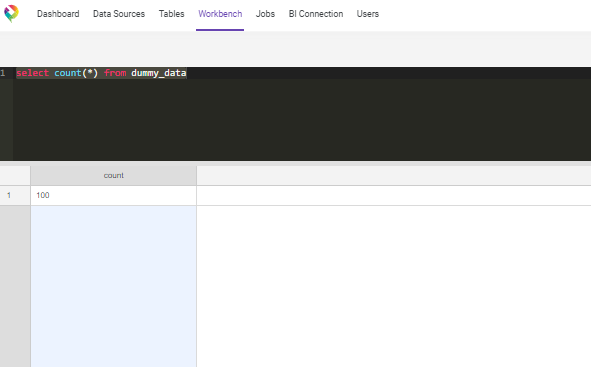
To make sure everything worked, check the row count in the workbench panel after the job completes.
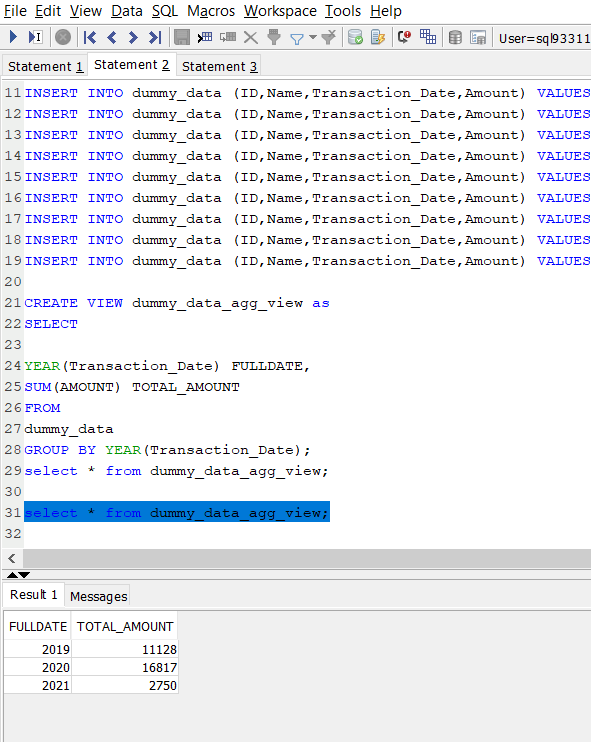
Create view on MySQL
Now, let’s head back to our MySQL data and create an aggregated view of our data. In the workbench, enter the query below to create a view:
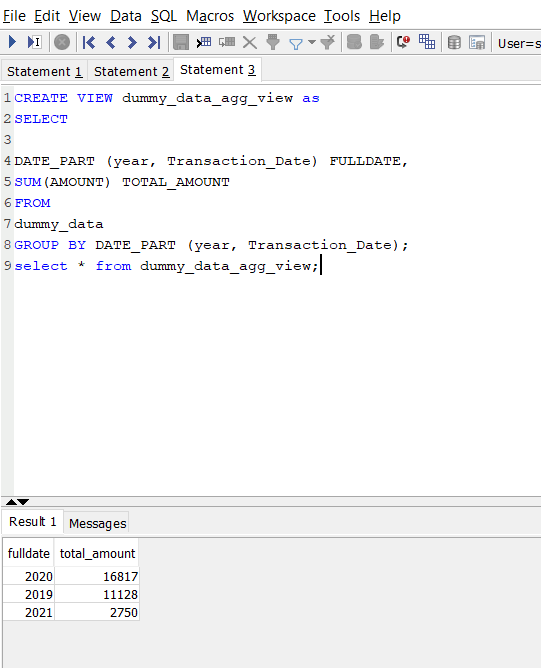
Next we’ll create the same view on our Panoply instance. Change the connection from file connect window as mentioned earlier and open new tab for Redshift.
Create view on Redshift
Note that because Panoply uses PostgreSQL syntax, some of the functions are not the same. So here, for example, the year() function is changed to date_part().
Work from Tableau
Now let’s do some visualizations. Panoply works with any data visualization or BI suite that supports ODBC, but for the purposes of this demonstration we’ll use Tableau. If you don’t already have Tableau installed, you can download a Tableau desktop trial, which supports Redshift (and therefore Panoply).
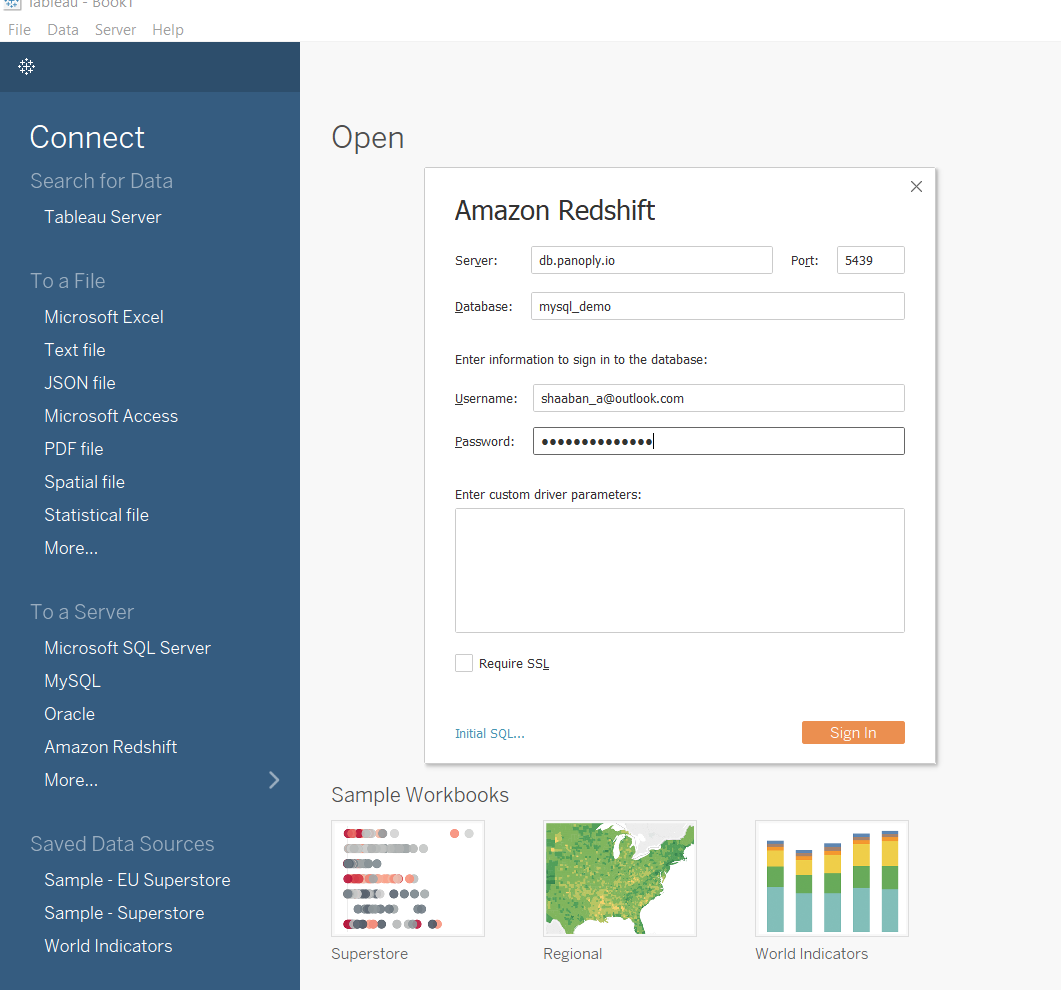
Connect Tableau
Use the Panoply connection credentials you collected above and enter them into the connection pane in Tableau Desktop.
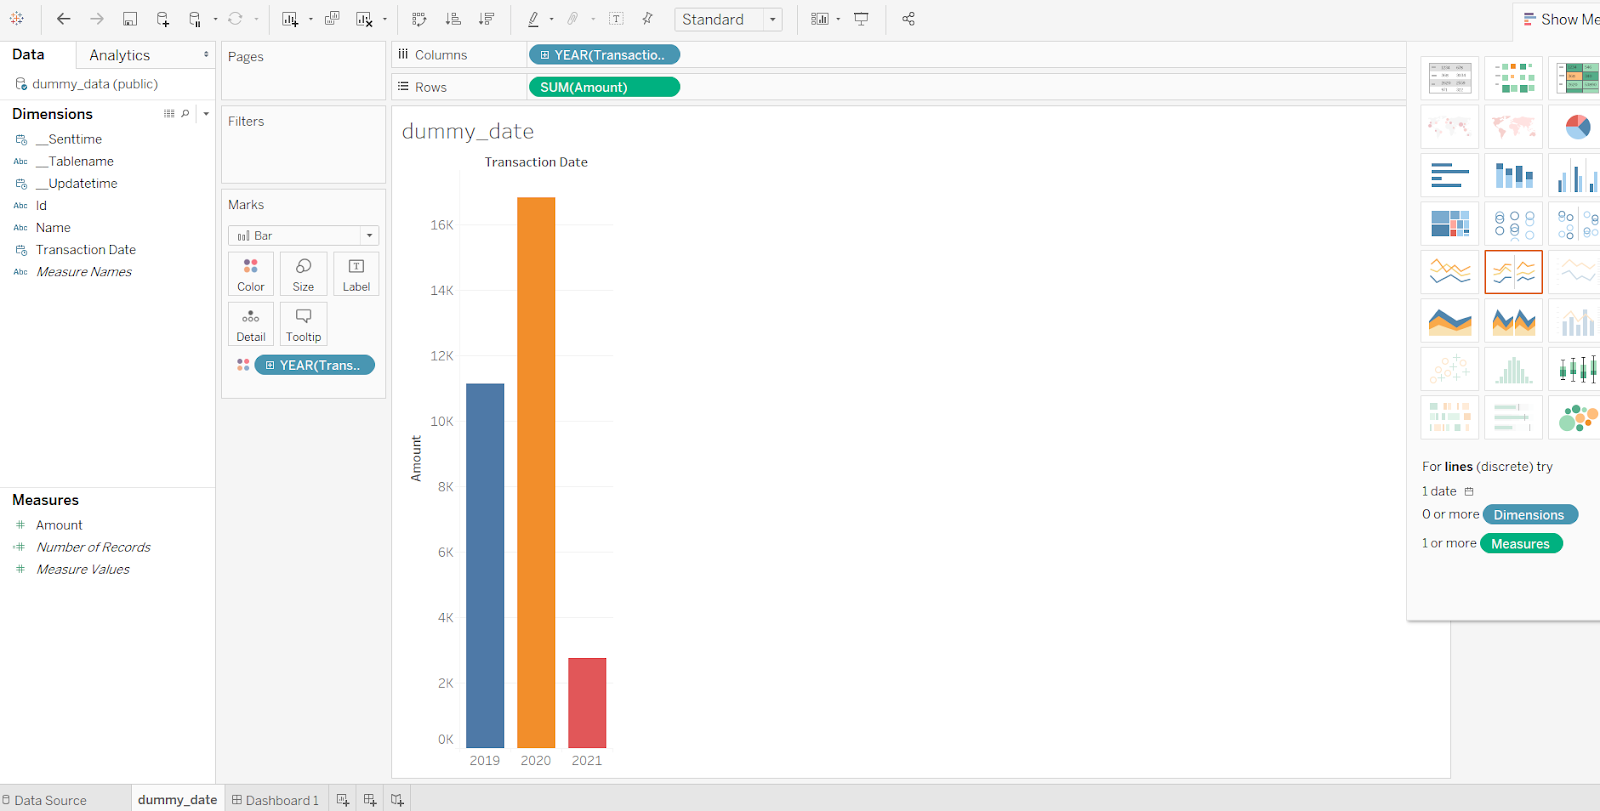
Create a simple Tableau dashboard
Now you can also see that this is the same output from the aggregated counts.