Power BI increases its adoption among the most experienced users each day. Thanks to being a user-friendly tool with various data sources to connect to, it helps analyze distinct data sources within the same console.
In this post, I'll show you how to import your data stored on PostgreSQL with a desktop version of Power BI.
I'll start by explaining what Power BI is and what it does. Then I'll offer an option to spin up a local instance to explore your PostgreSQL data with Power BI.
I suggest skipping the "Configure your local environment" section if you already have PostgreSQL and Power BI running or are familiar with Vagrant boxes.
However, I encourage you to look at it if you have some spare time. Leveraging Vagrant can be a valuable option to create your proofs of concept smoothly with automation tools.
Once we handle the infrastructure, we'll configure Power BI to connect to your existing PostgreSQL instance, explore some data on your Power BI instance, and transform it before its final load, creating a chart from your newly imported data.
What is Power BI?

Power BI is a data visualization tool created by Microsoft; it has different versions focused on other use cases. You can try PowerBI for free on Azure to interact with your existing services (such as Azure Synapse).
Another option is to have it installed on your "on-premises services" using an on-premises data gateway.
As Power BI grows more mature, it's naturally increasing in popularity, most of which is thanks to some neat capabilities offered to its users.
For example, it's quick and sweet to load your structured data as the source on Power BI. That lets you understand the trends of your data and have the answers you need faster than you're used to, making even the most demanding users happy as it's possible to explore more data sources.
And remember: better data gives better results.
So, with that said, if you're still struggling to consume your data correctly, I invite you to look at Panoply and how its integrated solution can ease this task.
Now that we understand what Power BI is: let's see it in action. We will dive right into connecting it to PostgreSQL, one of the most used relational databases options.
Connecting PostgreSQL to Power BI
Configure your local environment
If you already have a PostgreSQL instance, skip to the next section.
For those who don't have an instance, let's start by setting one up.
First, download PostgreSQL and Power BI (Windows only). But wait, suppose you're like me and are not that into having a Windows machine?
I suggest using Vagrant.
Haven't heard of or used Vagrant before? No problem! Take a look at this quick introduction for a good crash course.
After that, or if you're already familiar with Vagrant, you're ready to follow these steps:
- For starters, you'll need to download Vagrant and the Windows box used as the base image.
- Once you have Vagrant set up, you can download Power BI Desktop from inside; a VirtualBox client can do the trick.
- To follow along, download the database that we'll be using from here. By doing that, you'll follow along with a local Power BI instance on your machine.
Create a database connection
To get started, select the Get Data option after opening Power BI; this will open a window where you'll specify what kind of storage or database your data is stored in. The popup will show all data sources that Power BI can access.
For our exercise, we'll select the PostgreSQL database, as shown below.
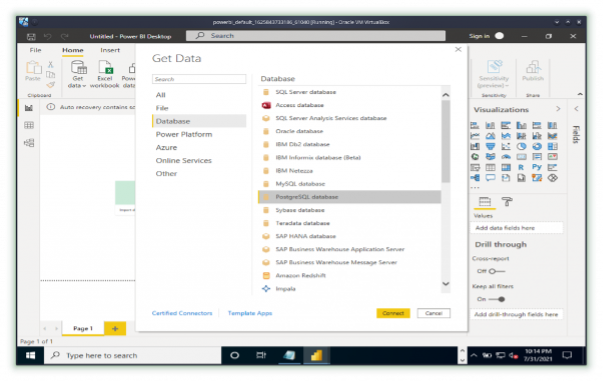
PostgreSQL database option on "Get Data" window
Once selected, Power BI will ask you to confirm the username and password the first time you connect to this database. There's no need to repeat this validation when you log in as the same user within the same server already used.
Just ensure that the specified PostgreSQL user has the permissions required on the database where your table resides.
Once authenticated on the server, you'll need to specify the server and the database.
Add your server (localhost if you have a local PostgreSQL instance) and the database where you'll select your tables. We'll select the Import option for the Data Connectivity mode since we'll be transforming some data before using it.
The DirectConnect option, as the name suggests, doesn't create this needed cache; I always recommend using Import instead of DirectQuery. One of the most significant flaws of DirectQuery is that it doesn't allow data transformation during the load.
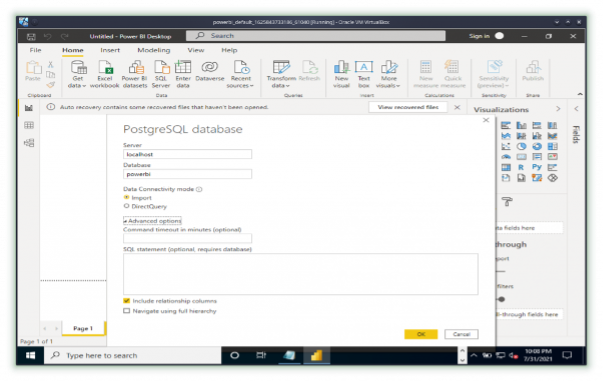
PostgreSQL database gets data screen
To keep it short and sweet, leave the advanced options unchanged and click OK.
Power BI will inform you before continuing in the case where your connection is not encrypted. If you click Cancel, it will stop the import. I encourage you to explore the SQL Statement option more, as it gives more choices to transform your data while loading it.
You can find more details and even a working example here.
Transform the data while loading it into your datastore
Now that we have taken care of our connection, it's time to make it work for us.
On the next screen, you can cherry-pick your tables. Once you select it, you'll have the option to either load it as is or transform it before using it.
Select transform, and a new window (like the one below), will appear.
In this tutorial, I'll split the first word from the remaining others using the leftmost delimiter. In the Select or enter delimiter field, leave the remaining options with space delimiter and quote character unchanged.
Doing so will transform the string field into two child fields.
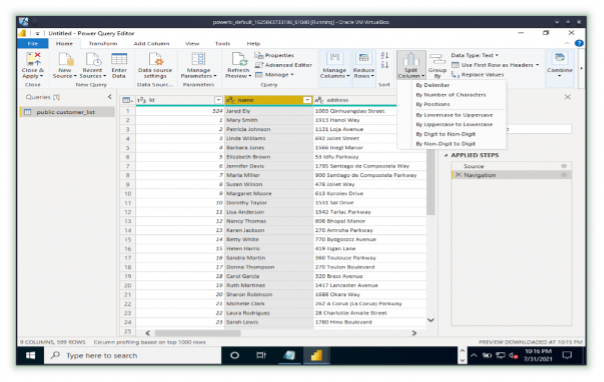
Split options for data import
Once you confirm the change, you will then go back to the previous screen. It will now reflect the changes you applied on the Split Columns screen.
It's good to remember that you can still remove these changes, even after the previous confirmation.
These results aren't final on the data sources used by the dashboards; instead, they're on temporary components. So, you can still go back if you want to add or change some extra details.
Once all your settings are as desired, select the Close & Apply option to commit your changes, as shown below.
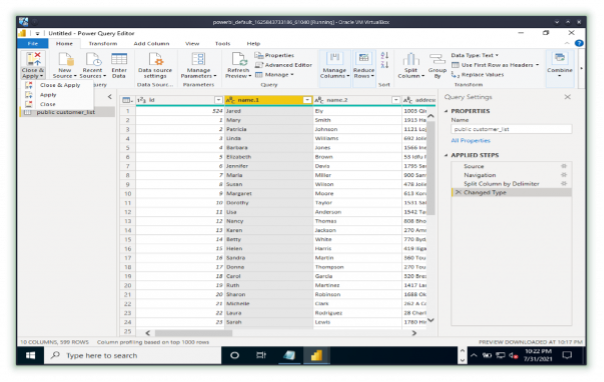
Preview "Get Data" after transformation changes.
Congratulations! You just imported your data from PostgreSQL into Power BI.
Start your data journey
Today we scratched the surface of integrating Power BI and PostgreSQL and breaking down how Power BI could enhance your data exploration on PostgreSQL databases thanks to its very user-friendly interface.
Power BI enables you to interact with the data in its early stages. Why not enrich your data directly from the source replication right? Just remember what your needs are.
It might be hard to have a complete view of your historical data trend analysis.
Having said that, a good thing to have in mind is to avoid, or at least restrict when possible, using Power BI on untreated data.
The data in its raw state is more for operational purposes. For time-sensitive analytical purposes, you should always choose to use treated information that gives better insights from application data in its raw state.
Still not so sure on how to start your data journey?
Check out how Panoply can help.
Now, go and have fun!


