At Panoply, we get a lot of customers who are looking to use Grafana to analyze data stored in DynamoDB instances. If you’ve ever looked into this, you’ve probably seen that Grafana doesn’t have any native support for DynamoDB, and isn’t planning on adding support any time soon. In other words, if you want to build a Grafana dashboard using data stored in a DynamoDB instance, you’re pretty much out of luck unless you’re ok making use of a 3rd party connector of some sort.
How we do it: the easy way
If you’re a Panoply user, though, things are quite a bit easier. Because Panoply has native connectors for DynamoDB and built-in support for Grafana, the process is pretty streamlined in comparison. And because Panoply is built on rock-solid architecture, it can do a lot more than just acting as a middleman for your DynamoDB-Grafana pipeline as well, like acting as single source of truth for all your data. It can integrate a huge range of data types, and easily connects to most data visualization and BI tools.
We’re going to lay it out in a step-by-step guide to building DynamoDB Grafana dashboards with Panoply below; if you want to follow along, make sure you track down your AWS Access Key and AWS Access Secret before getting started. If you’ve got one you are ready to use for this, skip to Pulling data from DynamoDB into Panoply below. If you’d like a quick walkthrough on how to set up a secure connection between DynamoDB and Panoply using IAM roles, we’re going to lay that out next.
Creating an IAM role for Panoply
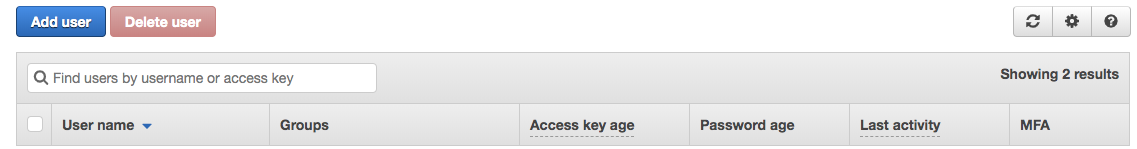
If you want to generate a set of Panoply-specific AWS Access Keys and AWS Access Secrets (recommended), head to the AWS IAM console and choose Users from the navigation pane. Next, choose Add user in the upper left (For the purposes of this guide, we’ll just create a new user on the account, but you can always add these privileges to an existing user if you’d like).
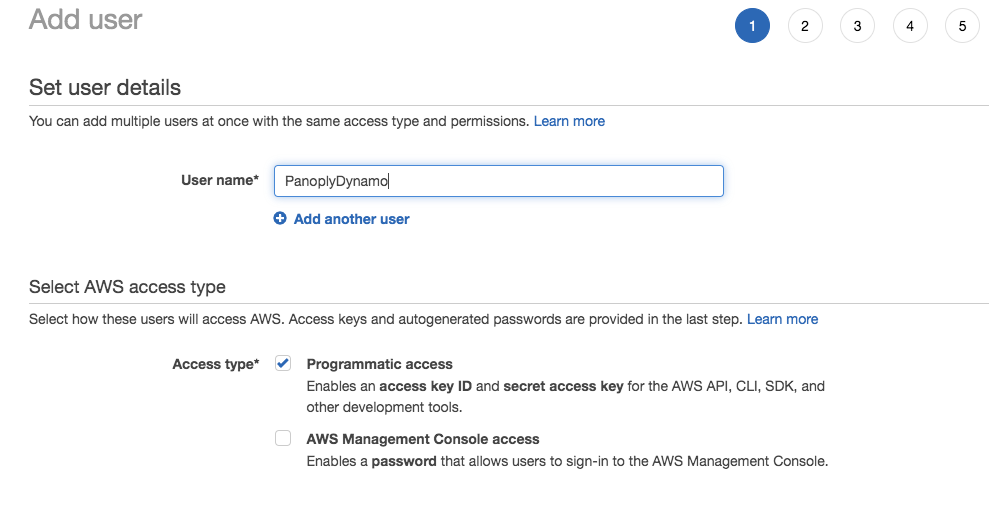
Choose a name for the new account and check the box for programmatic access so that you can generate an access key ID and secret access key.
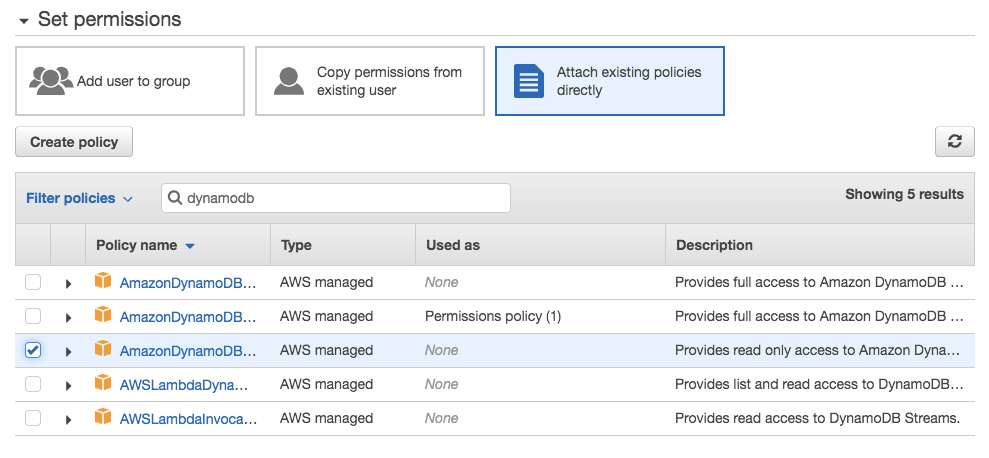
After you’ve entered the name you’d like to set for the account, click Next: Permissions. You can now add this user to an existing group, set up a new group for the Panoply user account, or just add IAM policies directly to the account you created for this guide. We’ll choose Attach existing policies directly from the options up top. Filter the existing policies by entering DynamoDB into the search box, then select the policy for read only access to DynamoDB as pictured below:
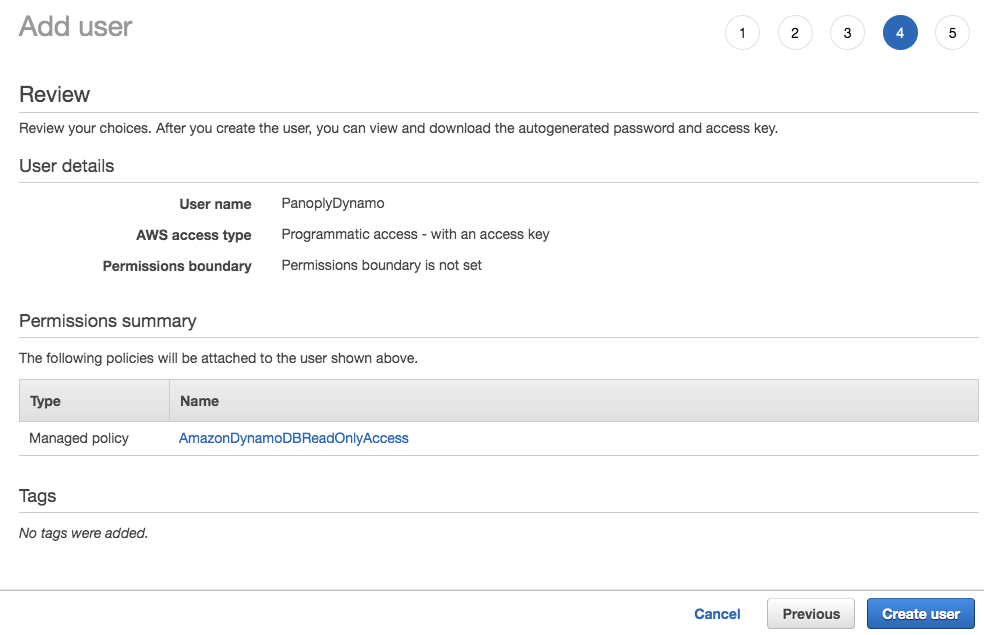
Click Next and set tags on the user if you want, but we’ll skip that step for now, bringing us to the Review step. If everything looks right, click Create user in the bottom right.
The next page will show your access key ID and secret access key. Make sure to store them securely (i.e. by downloading as a .csv), as you won’t be able to get them from Amazon again. You can always generate new keys, but you won’t be able to recover these particular keys if you lose track of them. Your keys should look something like this:
- Access key ID: AKIAIOSFODNN7EXAMPLE
- Secret access key: wJalrXUtnFEMI/K7MDENG/bPxRfiCYEXAMPLEKEY
Keep these keys safe, and don’t share your secret key with anyone outside your organization!
Pulling data from DynamoDB into Panoply
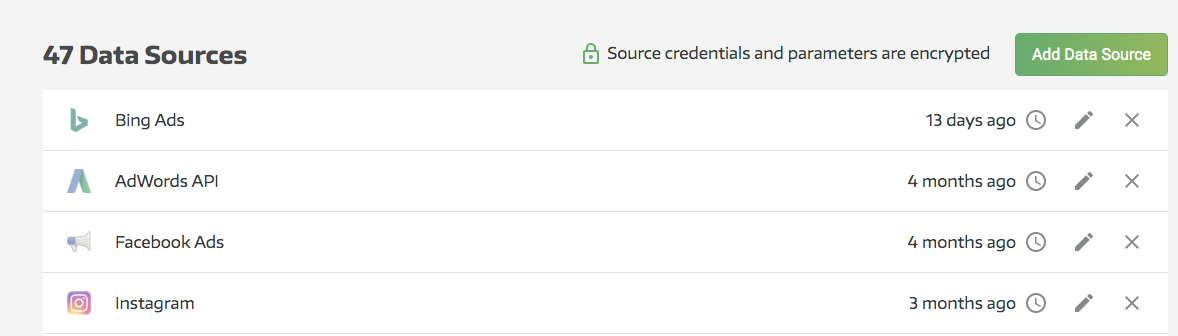
The first step is to connect your DynamoDB instance to Panoply (note: if you’ve already done this, feel free to skip ahead to a later section). From your Panoply dashboard, click on Data Sources in the left pane, then hit Add Data Source in the upper right:
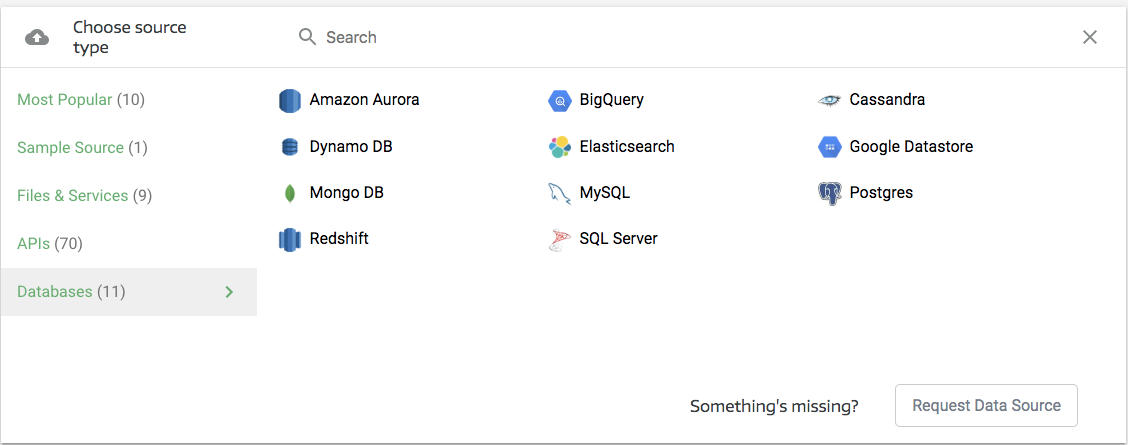
Which will take you into the data source selection section. DynamoDB will be under Databases (in the leftmost column):
Selecting DynamoDB will open a new pane, which will require you to enter your credentials:
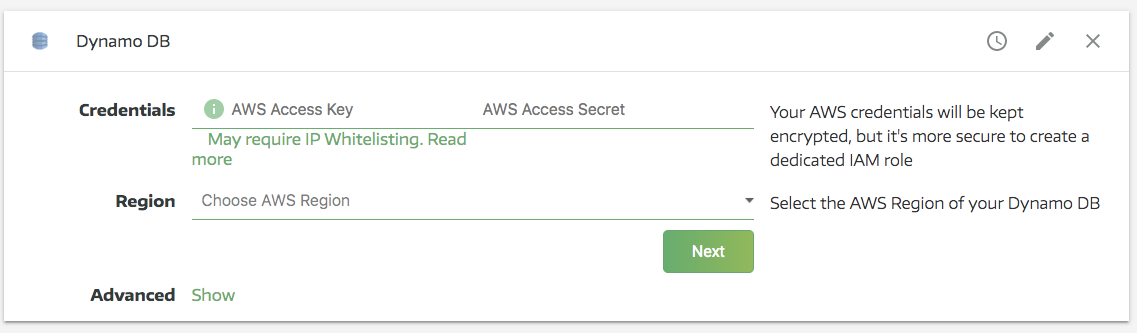
At this point, you might also need to set up IP whitelisting, depending on how your AWS access settings are configured. Restricting the IP ranges that are allowed to connect to your AWS instances is a straightforward way of managing your databases’ security, and if you’re following standard security practices with your AWS instance, you’ll definitely need to set up IP whitelisting. Whitelisting Panoply’s IP range will add Panoply to the list of approved connections for your database.
See the link above for the IP ranges Panoply’s data connectors use, and enter those in your DynamoDB instance’s IP whitelist. When you’re all set, hit Next, choose the tables you want to import, and set any other advanced options. Note that you can take advantage of Panoply’s job parallelization features here to set up multiple, separate imports. So, for example, rather than importing every single table in one go, you might find it more efficient to set up multiple connectors for different segments of your data. Select the specific tables you want to import in the next pane:
For the purposes of this tutorial, we’re using an open-access dataset of around 3M stock trades, but if you’re trying to build a Grafana dashboard, odds are you’re working with monitoring data. The principles are the same either way, though, so feel free to use the dataset linked above if you don’t have something better or more relevant to work with for now.
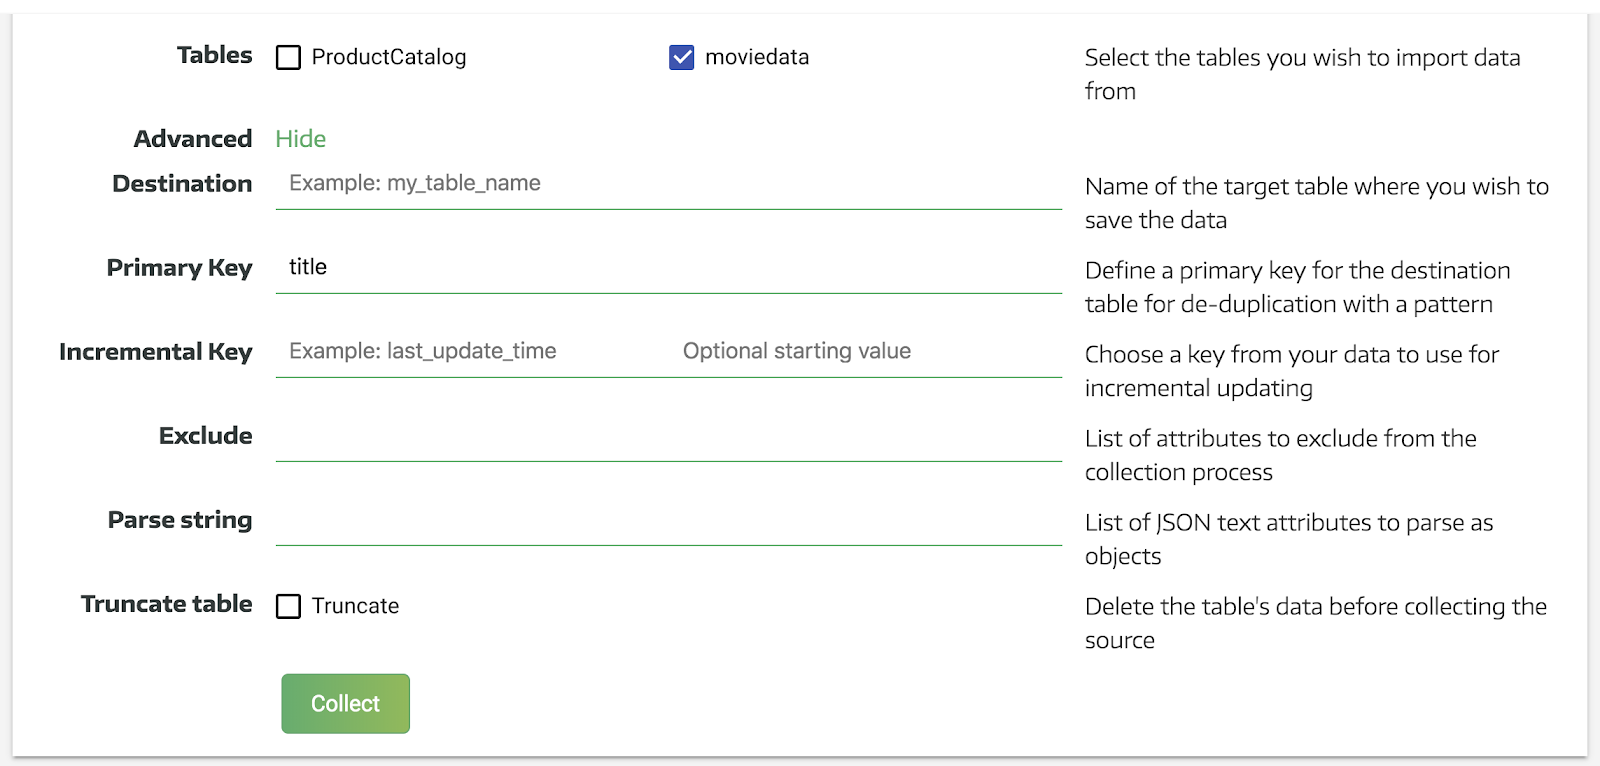
If you expand the Advanced options, you’ll see that you can fine-tune the data import by indicating a destination, primary key, and incremental key.
- Destination: allows you to give a name to the table that will be created in Panoply after importing, or a table-specific prefix if you’re planning on importing multiple tables
- Primary Key: allows you to set a primary key that will act as a unique identifier for each record in your table(s), and will also allow you to link related data across tables. If you set a primary key when setting up your DynamoDB instance, you can just re-use that here. This is the most important Advanced setting to pay attention to. If you already have a field in your tables called “id” or something similar, Panoply will use it as a primary key if no other parameter is set. If you don’t set a primary at all, you won’t see any deduplication in your data imports, so every single piece of data from the collection run will be added to your tables--you might not want that.
- Incremental Key: make sure to set this up if you’re planning on making multiple, recurring pulls from this data source. Doing so will make future imports more efficient, as Panoply will only collect data that has been updated since the last time you pulled from that source. Note that incremental keys will only work properly if you are pulling from a single table with this connector.
- Exclude: you can use this field to exclude specific data elements from your import. If there are specific types of data (e.g. irrelevant or sensitive data) that you would like to exclude from your Panoply data warehouse, you can use this setting to manage that.
When you’re all set, hit Collect. The Data sources - DynamoDB pane will go gray, and a green bar will appear above it to indicate progress. You can check the “Jobs” pane to monitor its progress if you want, but you’ll get an alert from Panoply once the collection has finished or . If you need to get data from another source while you’re waiting, you can just start that up as well. When your data collection is finished, head to Tables on the navigation pane to check up on your data. Because we used the stock trade dataset on our end, our data went from a JSON object containing data that looked like this:

To a set of tables that look like this:
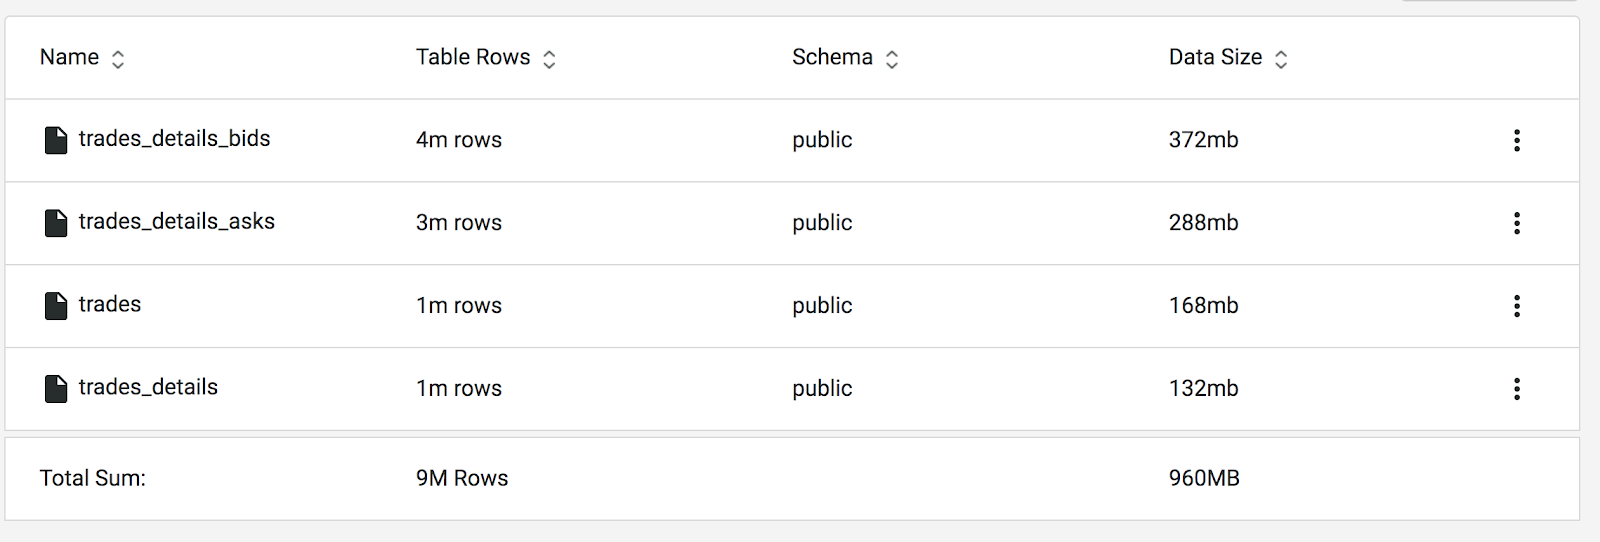
Panoply will often create multiple tables from a single table in DynamoDB because of the way it’s set up to deal with nested data. In order to unpack the nested objects that make up a NoSQL database, Panoply will create multiple, related tables to fit into the relational database structures it uses.
Connecting Grafana to your DynamoDB data
Now that you’ve collected the data from your DynamoDB and gotten it sorted into tables in Panoply, you can start in on building dashboards. To do that, you’ll need to connect Grafana to your Panoply warehouse.
Finding your Panoply connection parameters
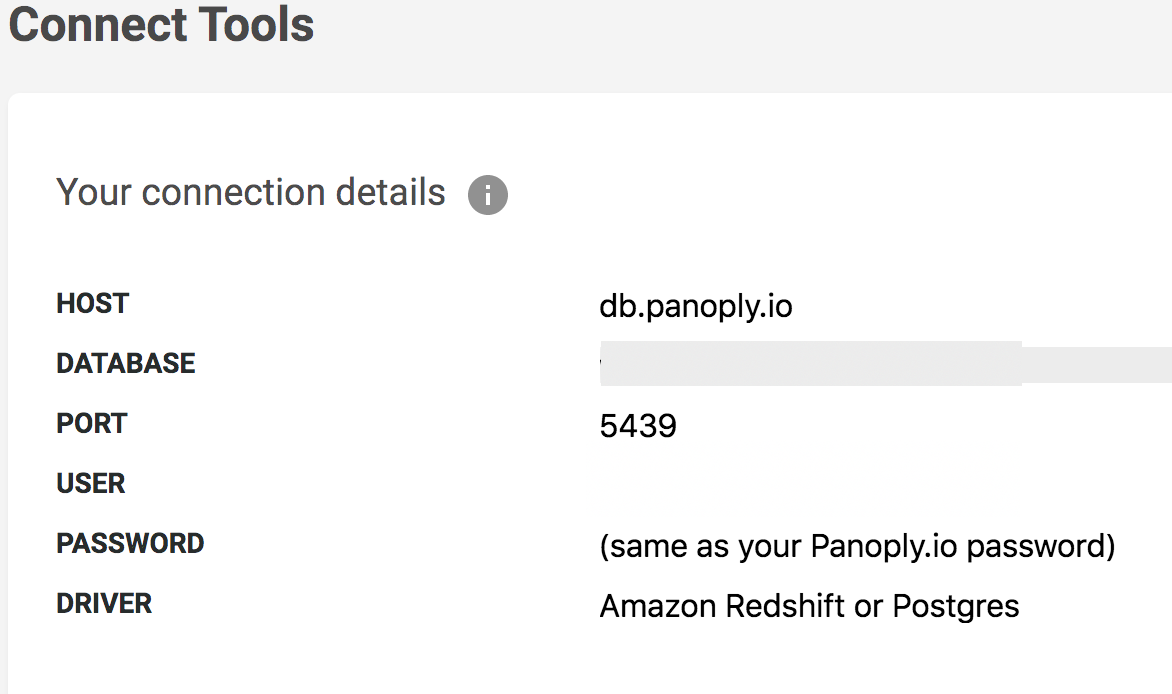
First, you’ll need to get the hostname, port and authentication details that Grafana will use to connect to your Panoply warehouse. You can find this by clicking BI Connection on the navigation bar in Panoply, which will bring up your warehouse’s details, like so:
Setting up the connection in Grafana
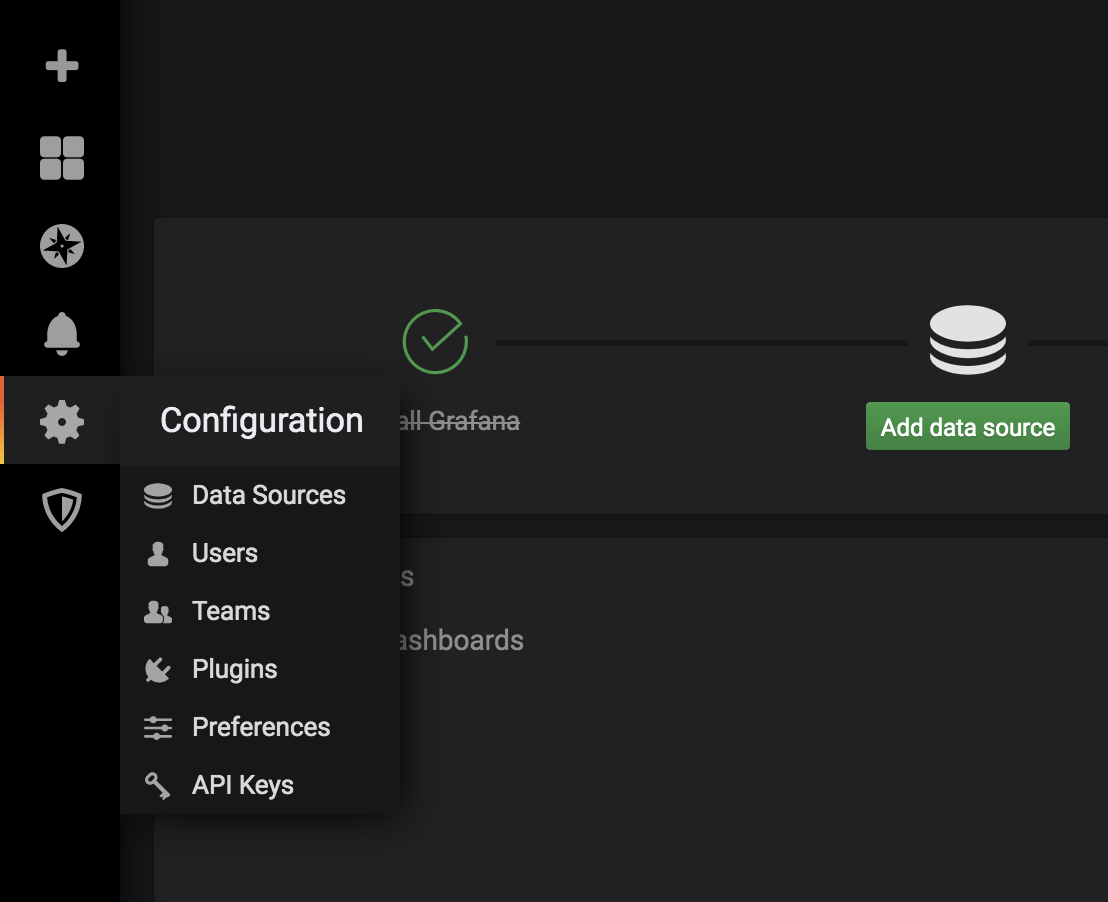
Next, you’ll need to enter this information on your Grafana client, so that it can access the data you want to analyze. There are a variety of ways you can get to the add data source dialog in the Grafana client, but the most straightforward is to select the cog icon on the left navigation bar, where you will see a data sources option:
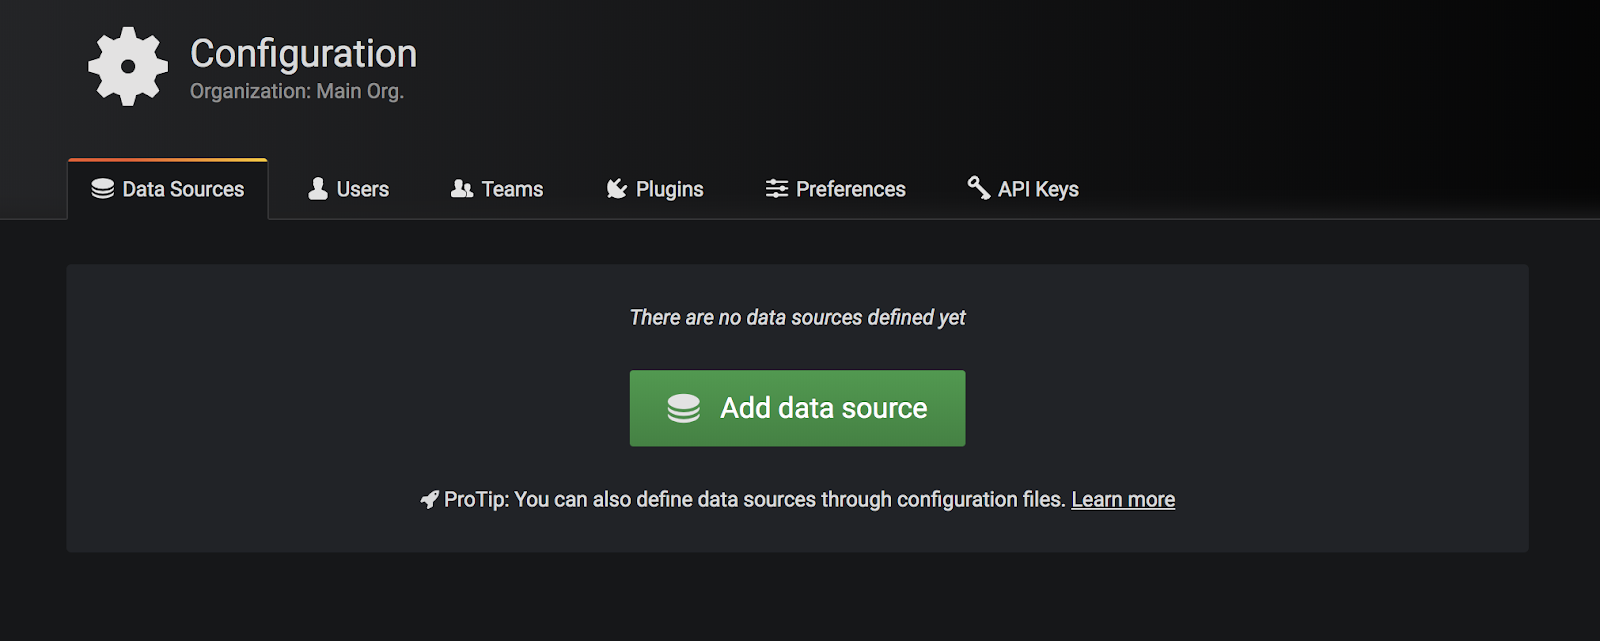
Select data sources. You will see an option to add data source:
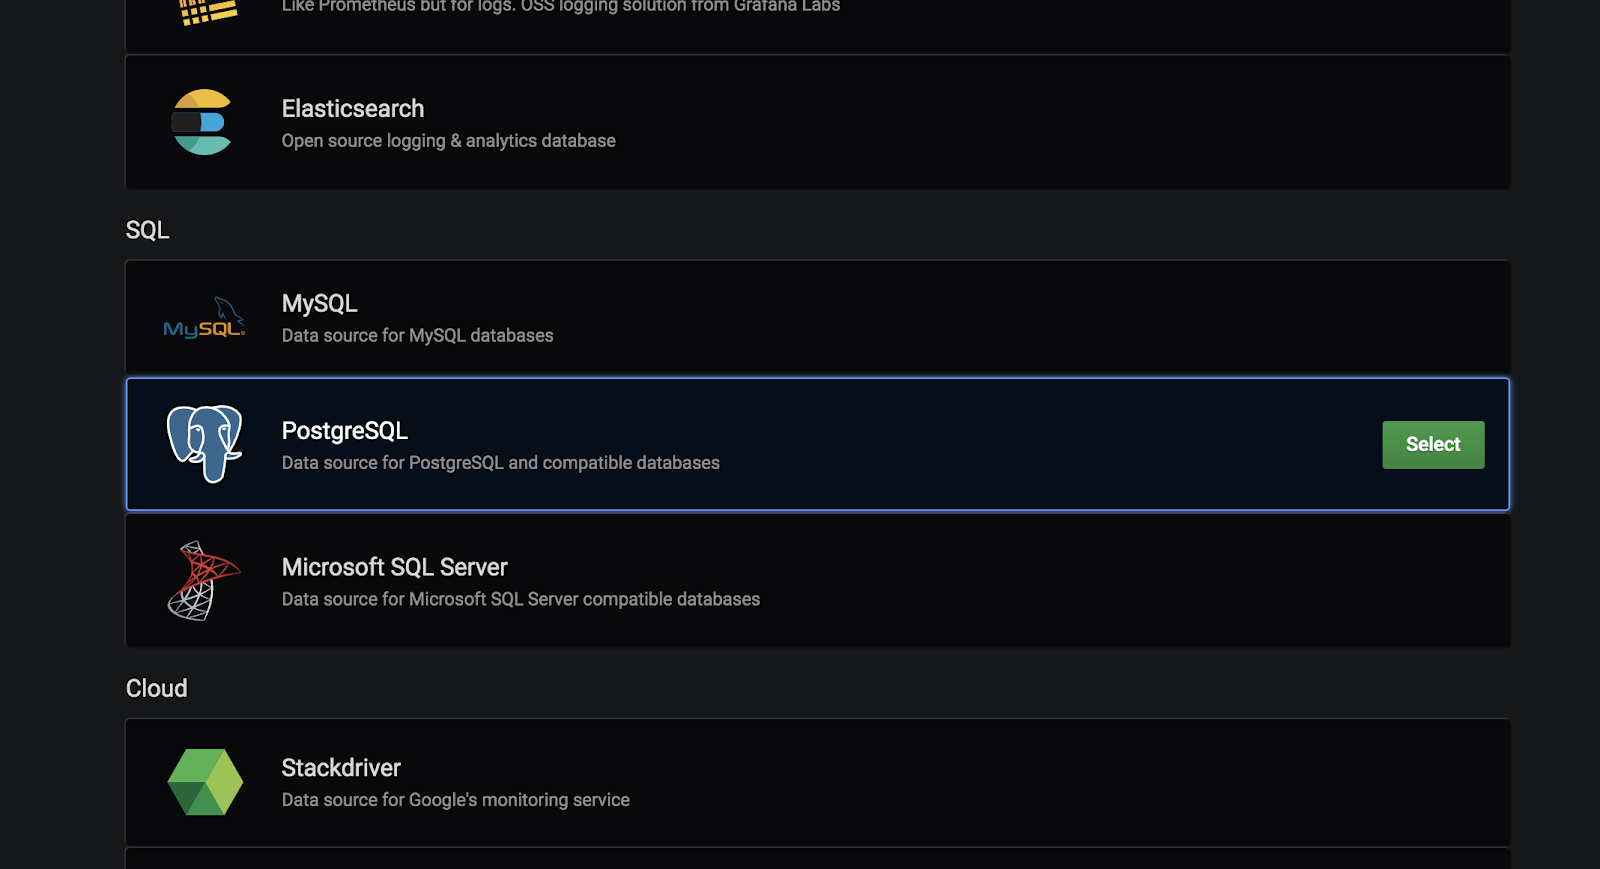
You’ll see a collection of data sources, organized by type. Grafana has native support for:
- Prometheus
- Graphite
- OpenTSDB
- InfluxDB
- Loki
- Elasticsearch
- MySQL
- PostgreSQL
- Microsoft SQL Server
- Stackdriver
- CloudWatch
- Azure Monitor
- Grafana Cloud
- TestData DB
And can connect to an array of other data sources through other plugins.
In order to connect to Panoply, scroll down to the SQL section and select PostgreSQL.
In the next dialog, you’ll be able to set up a nickname for your connection. You’ll also need the connection details you collected in the steps above.
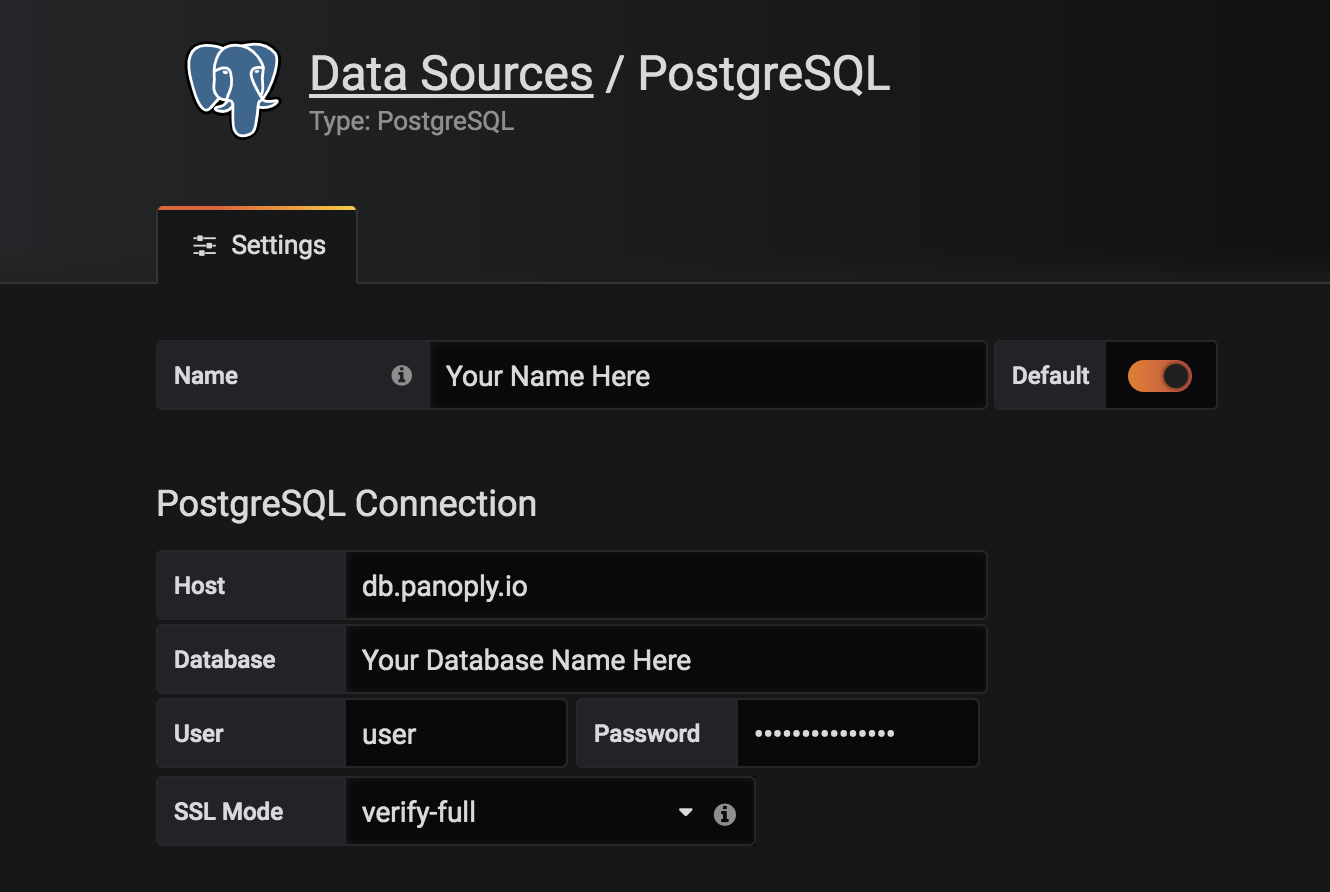
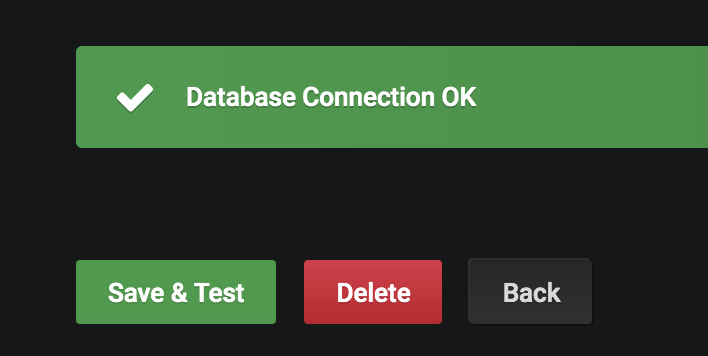
As a reminder, the login information should match what you use to login to Panoply. After you’ve entered your information, scroll to the bottom and select Save & Test. If all is configured correctly, you should see confirmation that the connection was set up successfully.
Exploring your DynamoDB data in Grafana
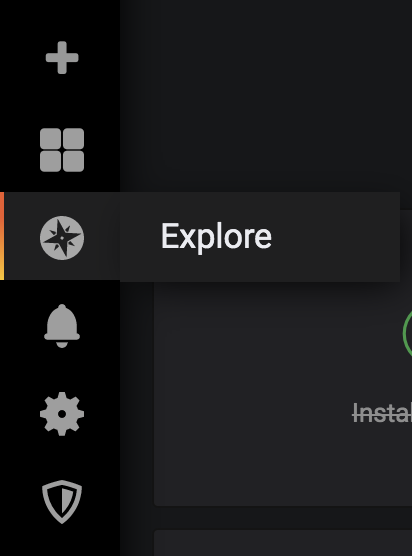
Now that the connection has been set up successfully, head over to the explore section on the navigation bar.
You’ll be taken to a new pane where you’ll be able to run queries on your connected data. In order to run a query, you’ll need to specify: data source, specific tables and specific columns.
Unlike some other BI and dashboarding tools, Grafana won’t automatically detect and populate a list of tables for you, so you’ll have to be quite specific about what data you’d like to pull in. In this case, since we’re using the trades dataset that we uploaded to our DynamoDB instance above, we’ll want to select “public”.”trades” for our first table here.
Now that we’ve covered the basics, let’s get to Grafana’s main use case: sweet dashboards.
Building a Grafana dashboard from data in DynamoDB
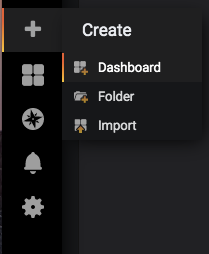
First, you’ll need to create a new dashboard. Find the create icon (like a large plus symbol) on the left navigation bar in Grafana and select create dashboard:
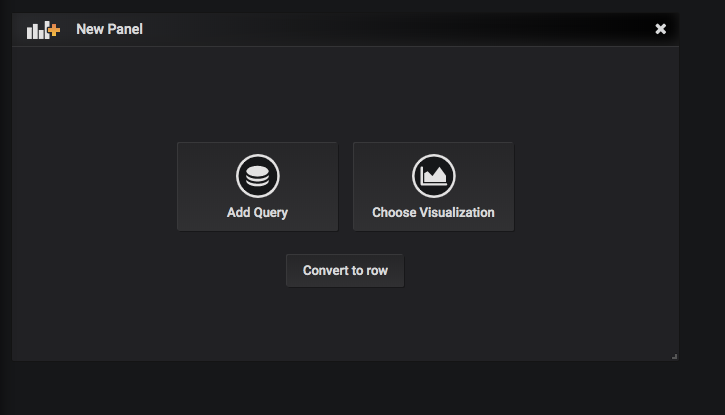
Next, select add query:
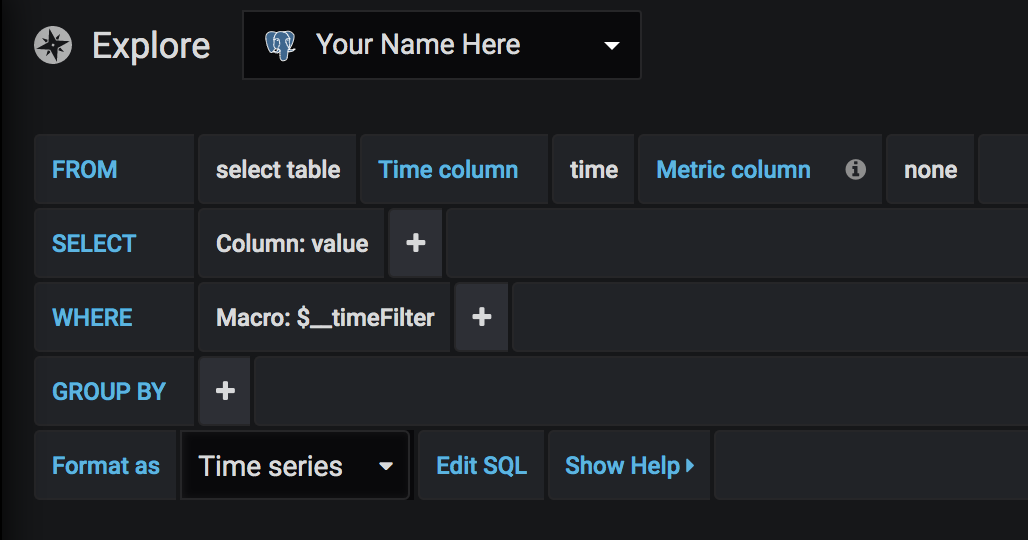
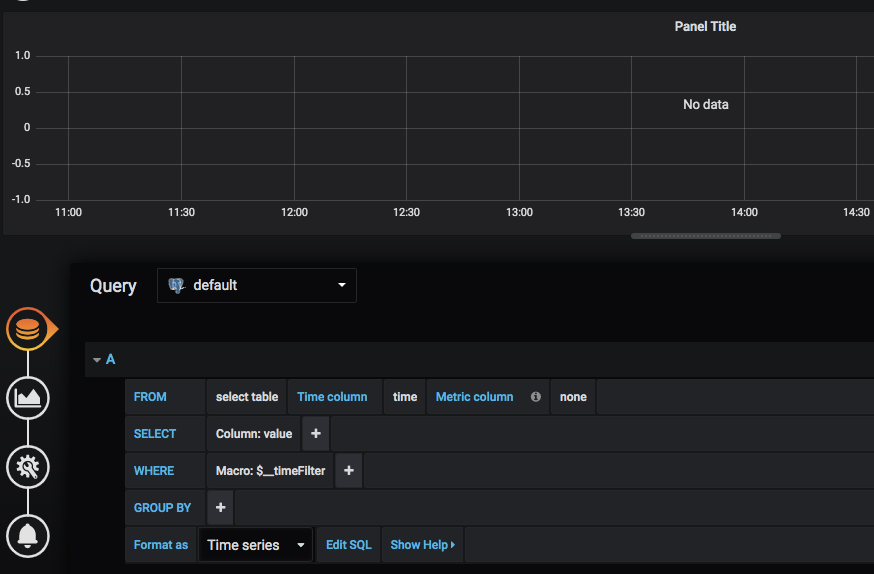
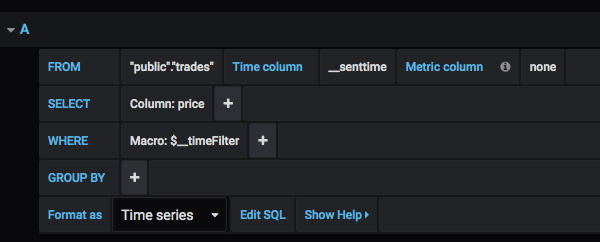
You should see a blank line graph across the top of the screen and a query builder pane underneath, like so:
If you’re using the trades dataset we mentioned above, you’ll want to enter “public”.”trades” in the FROM field. Grafana will then populate the rest of the fields for you, based on the table’s data. Select “time” as your Time column and “price” for the SELECT field:
You can also enter this as pure SQL using the built-in SQL editor, if that’s your thing. Next, select the time period you’d like to view using the dropdown selector in the upper right:
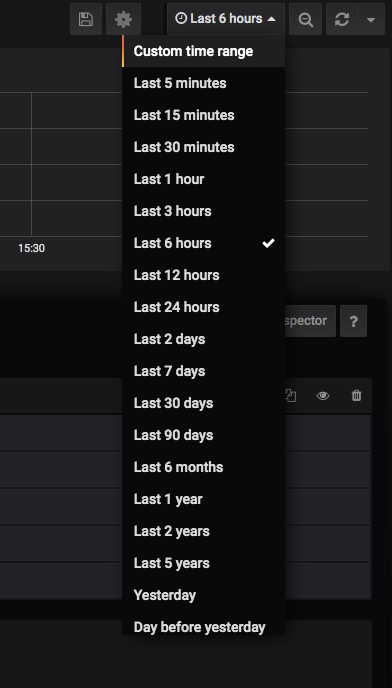
Because the stocks dataset we’re using is a historical dataset, you’ll need to define a custom time range for the visualization to work at all. Strictly for the purposes of this exercise, define the time period as 2012-03-03T02:00:00 - 2012-03-03T02:59:59. It will take a little while to query this dataset, since it’s a lot of rows, but if you’ve done everything right, you should see something like this:
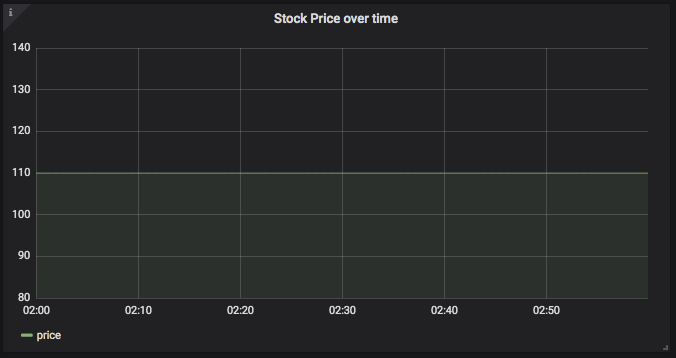
The line is flat because the price doesn’t change during this particular hour, but boy what a visualization, huh?
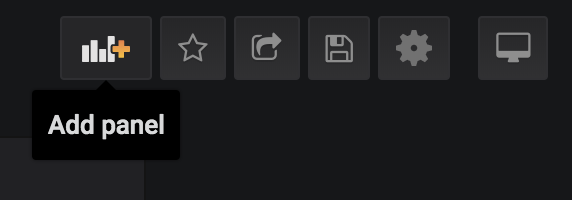
But it isn’t much of a dashboard without multiple panels, is it? To add more panels, first save your dashboard using the floppy disk-shaped icon on the top navigation bar. Now that you’ve saved the dashboard, you can start adding new panels to it (and editing the panels themselves to add titles, legends, etc). To add a new panel, find the add new panel icon on the top navigation bar:
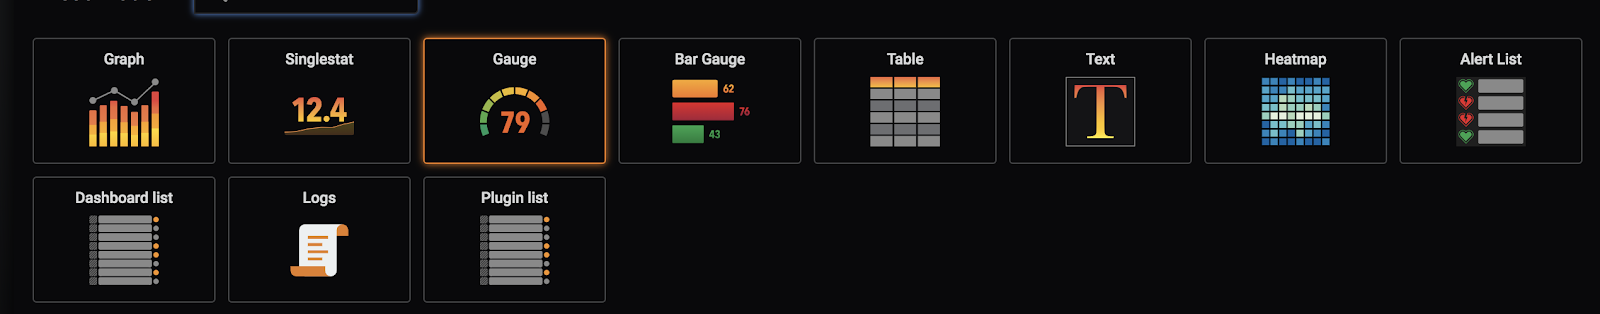
Which will take you to the same new panel dialog pictured above. Let’s try a new visualization for this panel. Try a gauge:
After you’ve selected your visualization style, you can choose the query that will feed it by using the navigation bar on the left:
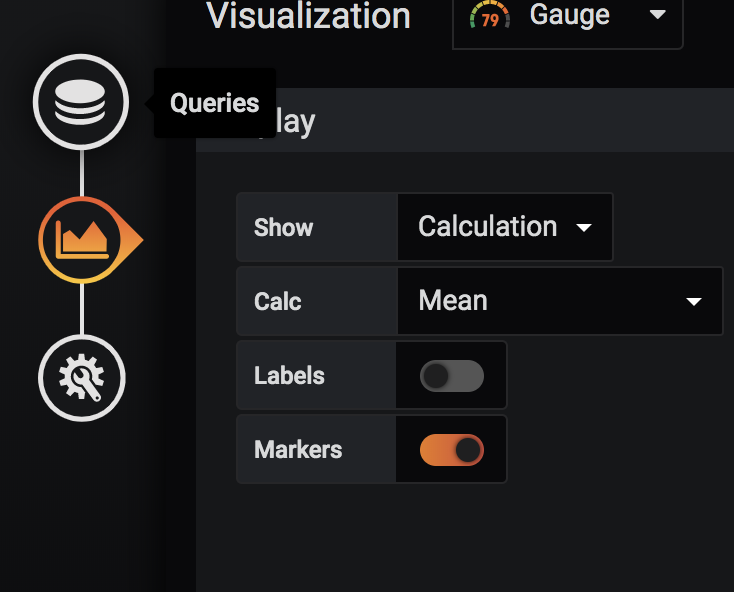
That will bring up the same query builder dialog we covered above. When you’re done selecting your data, you’ll have the beginnings of a shiny new dashboard, like so:
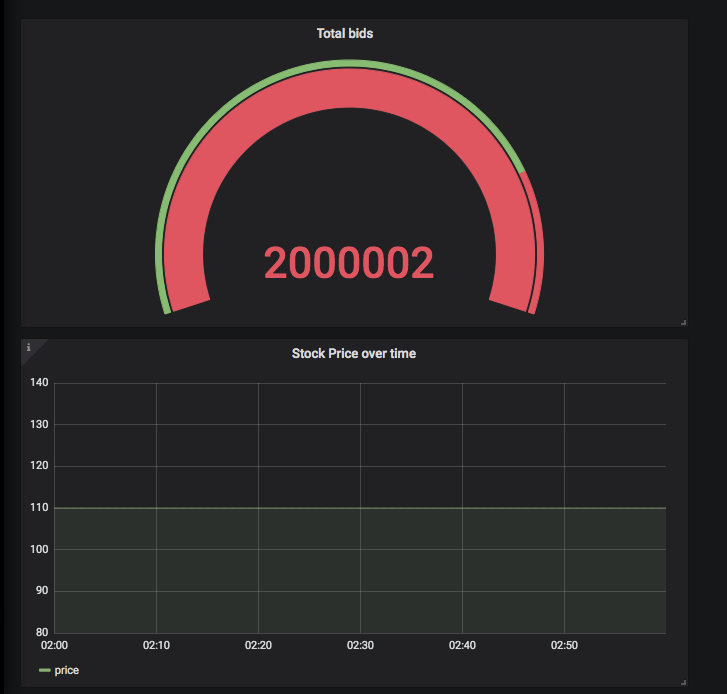
If you’ve followed this guide step-by-step to here: congratulations, you’re all done! You’ve now replicated your DynamoDB data and built your first Grafana dashboard with data from your Amazon DynamoDB instance. Even if you haven’t been following along directly with this guide, you should have a good idea of how to build a dashboard with DynamoDB data, as well as how Panoply can help make this process a lot smoother and easier.


