Innovative Boulder agency re-invents itself with a data-driven approach
Introduction
Digital marketing agencies are the visionaries and workhorses of the marketing world. From all those amazing Superbowl ads that we see each February to creative experiences in stores and at conferences/events, digital agencies are the creative power behind them.
One such innovative agency is Room 214, located in Boulder, Colorado. Room 214 offers marketing services such as customer insights, branding, marketing strategy, and campaign development for clients across the United States
Agencies work with in-house marketing teams for companies big and small to grow brand awareness, drive customer loyalty and hook customers with edgy and fun experiments. Digital marketing is also very data-intensive because teams want to see results, often in real-time of how campaigns drove numbers upwards. Another challenge - data sources are disparate, spread all over the web and in databases and other sources such as web analytics, ads performance, surveys. Finally, tracking revenue is difficult as data is needed to track sales and revenue presents a challenge.
In 2017, Room 214 saw the data-landscape and adapted their business accordingly. In effect, the company wanted to become very intentional about how data can inform decisions within their business and in that of their clients.
In marketing and digital advertising, success is measured with data and every aspect of the business relies on showing return on investment. Room 214 can now make better decisions for their business and for their clients as well, by being able to show concrete business affects in near real time.
We talked with Max Morganfield, Channel Strategist, and Jenn Casson, Managing Director, about how Room 214 uses Panoply as they focus on the data.
What was data and reporting like before Panoply - and what is the process like now that Room 214 has a data stack in place?
Before, in a word, it was onerous. We carried out a lot of copy/paste and used many, many spreadsheets. Clients had Google Sheets with historical data - and each month we had to go into countless social media platforms and manually export data from CSV into the central spreadsheets.
We conducted lots of screen-grabs of reports on ad metrics and pasted these screenshots into decks/presentations. The process was very siloed, manual, and prone to human error. We were spending more time creating the reports instead of analyzing the data and having valuable conversations around it.
Prior to having a data stack, reporting was somewhat of an afterthought as we delivered projects to clients.
Now, with our new data stack - being data driven with our metrics is central to conversations between teams and we’re able to look at the numbers together and develop more of a holistic view of what’s happening with our campaigns and why. Not having to manually wrangle so much data allows us as an agency to add context and value for our clients in a way we couldn’t before.
Also, our insights and analyses are richer since reporting is now key and output and ROI are paramount to every goal. We can have better conversations both internally and with our clients. Lastly, we’re now able to start with a strategy that revolves around data. We can completely rely on the data we have and take action on it accordingly in real time to reach a business objective.
How are you using Panoply now?
We use Chartio as our visualization tool of choice.
As for data sources we’re bringing in to Panoply, they include:
- Google Ads
- Programmatic Display and Display partners
- Social Media Platforms (Instagram, FB, Pinterest, Twitter, Paid Social)
- Google Analytics
- eCommerce
- Paid Search Platforms (Yahoo!, Bing, Google)
- Amazon
- Hubspot
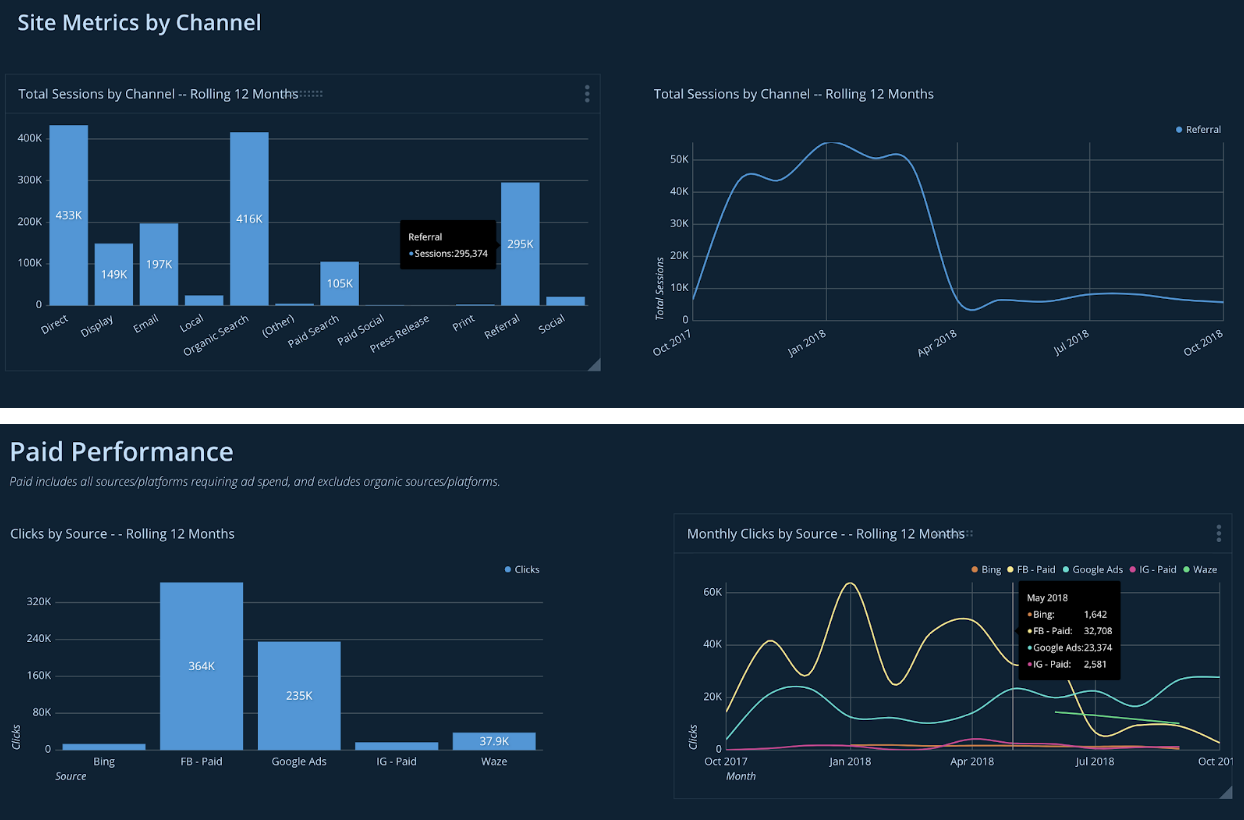
We’re creating interactive dashboards that allow our users to view client data in many ways, starting with the main KPIs we have defined as a digital marketing agency. Instead of looking at every metric available, we have settled on four key ‘categories’ of metrics that show marketing effectiveness through a variety of customer stages. Dashboards with metrics such as impressions, clicks, site metrics and conversions allow us to get out of the weeds and take a big picture look at what’s happening in the digital marketing space.
Would you need to have a dedicated data engineering team without Panoply?
Yes, we’d have to have a PostgreSQL DBA, an analyst to optimize queries and more. Also, we’d have to have a part-time or contract engineer building data connectors and ETL solutions for a multitude of data sources.
With Panoply, we enjoy having a hosted cloud solution without needing to babysit servers or write ETL code constantly.
Lastly, we’ve been aided by Panoply and Chartio’s support/care teams - they’ve answered questions and have been amazing during our time working with them.
What has the new focus on data done for Room 214?
With our Panoply powered data stack, we’re more nimble, more accurate and more analytical. With the new solution, we have:
- Less human error
- No more silos
- More time for strategic thinking & data insights discovery
- Ability to pull in many new data points without added effort/time involved
Tell me more about Room 214’s evolution of becoming a data-driven agency for clients:
To be competitive moving forward as a company - it’s all about data access and analytics. Let’s allow data to inform all the work we do - even in things such as creative, image creation and content. With these tools, we now can collect, analyze and rapidly process all the ad-related data being thrown at us - it’s amazing.
To be competitive moving forward - we need to effectively use data analytics to drive decisions in everything we do.
As a marketing agency, we’re operating in an environment where we don’t have all the information - there are a lot of unknowns. The trick is to use the data we do have available and treat each campaign as an experiment in which we’re garnering more data.
With the data stack Panoply provides , we’re able to quickly capture and analyze this new data, learn from it, discover and experiment with it and of course use it to inform our next decision.
Thanks for joining us, Room 214!


