Marketers have long relied on legacy methods like spreadsheets and manual effort to track their key performance indicators (KPIs). But today, with the rise of digital marketing dashboards, organizations can quickly and easily monitor their progress in one place.
A marketing dashboard is a single source of truth for all your digital marketing analytics. It automatically pulls data from multiple sources into a unified view that’s easy to interpret and share with stakeholders. An intuitive design allows you to identify trends, measure success against goals, detect problems before they happen, and more.
But what are the most important marketing KPIs to track in a dashboard? A recent study of leading marketing executives showed that the vast majority (95%) agree that for meaningful results, the KPIs used in their analytics dashboards need to be connected to wider business objectives.
This article will explore the top 7 marketing dashboard KPIs to help your team measure success and align with your company's overarching objectives.

Source: Investopedia
Top 7 Examples of Key Digital Marketing KPIs
When selecting KPIs, it’s essential to consider factors such as what industry you are in, which channels you are using, where your customers live and how much time they spend engaging with content. All these elements will influence the types of KPIs that make sense for your company.
Once you have a good understanding of the context and goals for each campaign, here is a list of 7 top KPIs on marketing dashboards to consider, with examples:
1. Return on Investment
Return on Investment (ROI) is a crucial digital marketing KPI essential for tracking the success of your efforts and understanding where to focus resources. To calculate ROI, simply divide the total gain or loss from an investment by the total cost of that investment and multiply the result by 100.
For example, if you invested $100 and only gained $20 in return, you would experience an 80% loss. However, If you spend $100 and it brings in $120, then it is a 20% ROI. When displayed in a dashboard, it helps you quickly identify what campaigns are performing well and which need improvement. Benefits include:
- Tracking progress towards overall goals. ROI allows you to measure the impact of each marketing drive compared with its costs and other KPIs, so you can see if your investments are leading to desired outcomes.
- Making data-driven decisions. Instead of relying on gut feelings or intuition when evaluating performance, ROI gives you hard evidence so you can make more informed decisions
- Identifying what’s working and what isn’t. Seeing ROI in your dashboard helps you quickly identify which campaigns are worth investing more in and which should be improved.
- Understanding customer lifetime value. Utilize ROI data to identify customers’ long-term value and develop strategies accordingly.
Return on investment as KPI provides insights into how much resource each campaign generates compared with its costs, helping you track progress towards overall goals and quickly identify what’s working and what needs improvement.
2. Return on Ad Spend
Return on ad spend (ROAS) tracks the effectiveness of your campaigns and helps you understand how much you are getting for every advertising dollar spent. This metric can help marketers identify where their money is going, whether towards successful or unsuccessful campaigns, and focus resources accordingly.
Return on investment (ROI) is a measurement of how effective the money you spent on marketing has been. It measures the amount that your campaigns have earned back, as compared to what was spent.
Both metrics are important for understanding marketing performance, but there are some key differences between them. ROAS focuses more on measuring effectiveness over the course of a specific campaign, while ROI looks at the total amount made from an initial investment.
Specifically, ROAS as a KPI allows you to:
- Improve budgeting decisions. Understand which investments are paying off.
- Streamline optimization process. Quickly identify areas to improve.
- Accurately measure success and ROI. Determine whether your campaigns are worth the investment.
- Monitor performance. Track improvement over time is an invaluable tool for budgeting decisions and streamlining optimization processes.
- See how your ROI compares with your competitors’. You can use this data to identify areas where you may need to adjust your spending to become more competitive and maximize returns.
By tracking ROAS through a comprehensive digital marketing dashboard, you can keep tabs on how well each investment pays off compared to others in the industry. Doing so allows you to make well-informed decisions about how to use your resources best and compete with other businesses.

Source: Profit.Co
3. Goal Completion Rate
Tracking goal completion rate is an essential KPI for any marketer looking to optimize their website and marketing campaigns. Understanding the percentage of website visitors who complete a specific action, such as filling out a contact form, helps you identify which pages and content are most effective at driving conversions.
It also allows you to:
- Assess the overall effectiveness of your marketing campaigns and website
- Identify areas of your website that need improvement to increase conversions
For example, a retail store may measure the goal completion rate of its website by tracking the number of customers who purchase products online. If visitors are converting at a low rate, it could indicate a problem with their website or marketing strategy that needs to be addressed.
4. Channel Effectiveness
If you’re a small to medium-sized company looking to blend data from multiple sources, channel effectiveness is a must-have marketing dashboard KPI. It tells you how well your channels perform and can help you optimize marketing strategy, budgeting, forecasting, and customer acquisition costs.
Knowing which channel is driving the highest return on investment allows you to:
Make data-driven decisions. By understanding which channels provide the highest value, you can make more informed decisions about where to focus your marketing efforts.
Improve customer acquisition costs. With a clear view of channel performance, you can adjust spending across different channels to optimize cost per acquisition and reduce waste.
Enhance forecasting accuracy. You will have a better idea of how much budget should be allocated for each channel to reach sales targets.
Increase ROI from campaigns. Knowing which channels are performing well can help you plan campaigns that will drive higher returns on investment.
Suppose you ignore the channel effectiveness KPI in your dashboard. In that case, you can miss out on potential growth opportunities and overlook areas where improvements could maximize marketing ROI.
5. Campaign Performance
Monitoring campaign performance is a critical element of any successful marketing strategy. It allows you to track your campaigns' performance in real-time and adjust accordingly.
With the right dashboard KPIs, you can easily measure your:
- Reach and engagement of campaigns
- Conversion rate
- Cost to acquire customers
- Average order value
- Customer lifetime value
Having these indicators in one place on a dashboard can give you an edge when evaluating the success of your marketing efforts, allowing you to identify areas that need adjustment or improvement quickly.
Source: WordStream
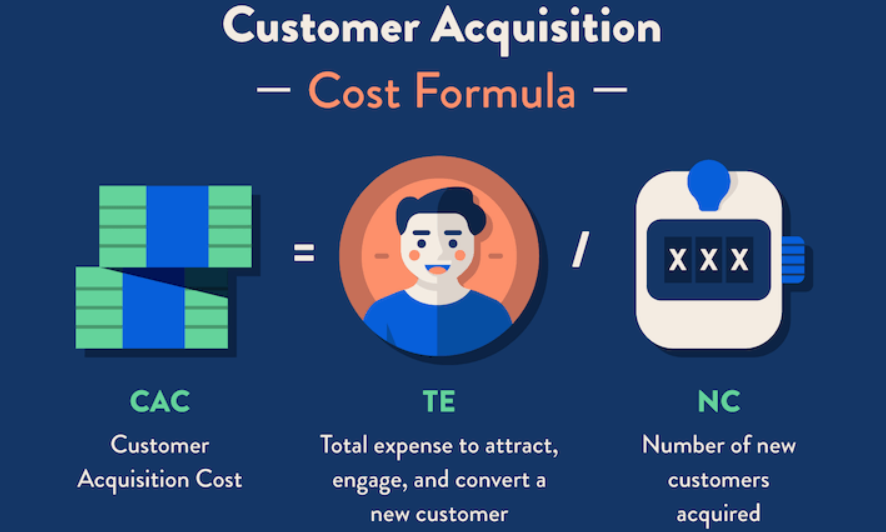
6. Customer Acquisition Cost
Customer acquisition cost (CAC) is a metric that assesses the average cost of procuring new customers, taking into account all sales and marketing costs. This KPI is essential for marketers as it can give them insights into how successful their sales and marketing approaches are.
The advantages of keeping tabs on CAC include:
- Recognizing which advertising channels and campaigns are most efficient at getting high-value clients
- Discovering options to improve expenses in marketing and selling
- Measuring the profitability of customer acquisition attempts
- Setting budget allocations based on the most economical pathways and plans
- Empowering marketers to establish realistic income objectives dependent on customer acquisition costs
Tracking CAC in your marketing dashboard is essential for making informed decisions about budget division and pinpointing areas for enhancement.
7. Customer Lifetime Value
By measuring customer lifetime value (CLV), you can estimate the total amount a particular customer will bring to your organization throughout their relationship with your business.
Knowing this figure allows you to choose more wisely how much to invest in gaining and maintaining customers while giving precedence to those customer segments of high worth. Other advantages of using CLV as your KPI are:
- Greater customer insights. CLV gives you deeper insight into your customer base and helps you better understand their needs and preferences by examining their lifetime purchase pattern.
- Improved ROI. By focusing on high-value customers, marketers can target efforts more efficiently and get a better ROI.
- Cost Savings. Knowing how much each customer is worth helps you make more informed pricing decisions and optimize marketing budgets.
When used correctly, this marketing dashboard KPI can help create a better understanding of customers’ needs and preferences, resulting in improved ROI and cost savings.
Is It Time to Update Your Dashboard?
Tracking and visualizing the proper marketing KPIs is essential to business success. A comprehensive marketing KPIs dashboard allows you to track your performance in real-time to make agile decisions based on the data.
With Panoply's combined cloud data warehouse and ELT, everyone wins when data flows freely; you'll have access to all of your marketing metrics without worrying about IT infrastructure or manual maintenance.
If you'd like an easy way to monitor your KPIs with a managed service and get insights from your data quickly, contact us for a free demo today.


