Understanding ETL (Extract, Transform, Load) platform pricing models is crucial for managing data processing costs. ETL platforms typically bill usage based on the amount of data loaded or manipulated monthly. Familiarity with the industry’s pricing models empowers decisionmakers to compare pricing apples-to-apples and to make the best decision.
In this article, we will discuss the basics of rows in the context of ETL platform pricing and how platforms use rows to calculate customer usage.
What is a row?
Simply put, rows are collections of observations which populate tables, running horizontally in structured dataframes. While ETL platform pricing models differ in the details, the general principle of the row holds constant.
Think of a simple spreadsheet: columns (aka, attributes) go across the top, while the data populates the table, filling rows (aka, observations). In the context of ETL platforms, we become particularly interested with the number of rows processed within a billing period.
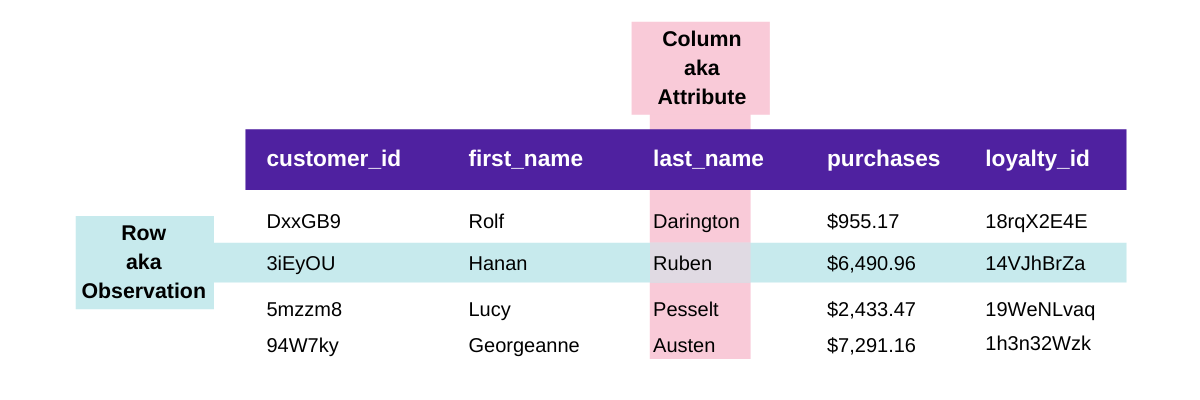
Let’s consider an example dataframe which contains historical sales data from a local retailer. The dataset has attributes including customers’ unique ids, first and last names, total purchase in USD, and loyalty member numbers. If the retailer had data on 1,000 unique customers, the dataframe would have 1,000 rows of data.
In more dynamic settings, datasets may be updated frequently resulting in high row counts. For example, let’s consider a web scraping project where a data engineer pulls pricing and product data from an online retailer’s website daily. In the initial query, 10,000 rows of data are extracted and then loaded into a dataframe for analysis. Each day after, the script is run again and a percentage of the rows are updated and new rows are added as the data changes or new products are introduced. In such environments, dataframes can grow to contain many rows.
Fivetran: Monthly Active Rows (MARs)
Fivetran’s consumption-based pricing model considers three types of rows:
- Rows at Rest - the total number of rows from a given source.
- Rows Updated - the percentage of rows which are updated regularly within a month.
- Monthly Active Rows - the number of distinct primary keys synced within a monthly period. MARs are the basis of Fivetran’s pricing model and are only counted once per billing period, even if they’re updated multiple times.
In order to learn how to calculate MARs, let’s consider an example. If a user processes 50 millions rows at rest, and 10% of the data is updated within the month, the total of Month Active Rows would be 5 million.
According to Fivetran’s Service Consumption Table, “Usage of the Fivetran Service is charged on the basis of ‘Credits’ which are purchased and which provide value based on the MAR Threshold, as set forth on the Service Consumption Table, and the actual number of MARs used by the Customer in a given Billing Period.” In more simple language, this means that MARs are exchanged for credits assigned to your account each billing period.
Monthly Credits are spent based on the number of MARs within each account during a set billing period. Credits are consumed in such a way that incentivizes more unique data to be synced—incremental costs per unique MAR are cheaper as data is added. How much Fivetran charges per credit corresponds to the pricing plan selected, and a number of other factors including the use of supplemental credits through their On-Demand program.
Stitch: Replicated rows
Stitch measures row usage in “replicated rows.” Replicated rows can include new rows which have never been replicated through Stitch, updated rows (modified existing rows), sub-rows created from de-nesting previously nested data structures, and copied rows which are replicated.
Stitch’s pricing is based on data volume, scaling with the number of rows. When the user replicates a new or updated row from a connected data source, that data counts against the account’s monthly row limit.
There is another wrinkle, however: With the lowest-tier Stitch plan, only 10 standard sources are included. Popular standard sources include Salesforce, Oracle, Microsoft SQL Server, and Amazon RDS among others.
While many popular sources have full support from Stitch, some connectors available are community-supported rather than Stitch-certified. Ultimately, the difference to note here is that in the event that a community-supported connector stops working, users are responsible for the repair rather than Stitch.
Stitch offers two versions of their platform: Standard and Enterprise. The Standard plan supports up to 5 users and 300 million replicated rows per month, while the Enterprise version has higher custom limits for both users and maximum rows. In the Standard Plan, per row pricing decreases considerably in the plans which support higher row counts.
Panoply: Rows scanned
At Panoply, we define rows scanned as the total number of rows successfully scanned from a data source during collection. That’s different from Fivetran and Stitch in that their pricing hinges on the “load” portion of the ETL process, whereas Panoply’s rows scanned is measured at the point of extraction.
Panoply offers several features to help keep costs under control. First, we don't count subtables and nested data against your total, so you're paying for the rows scanned, not how your data is structured. Next, storage for rows scanned is included in your plan, unlike many competitors. Knowing that storage will be included in your rate allows customers a degree of consistency which helps with managing charges.
Something else to keep in mind when comparing ETL providers is how much control you have over the data you bring in. While data sources with wide tables (that is, tables that include a lot of columns in a single row) may be fairly cost effective, data sources that have many smaller, more focused tables will result in more rows scanned. Being able to pick and choose what data you bring over—as you can with Panoply—can save you money.
Plus, Panoply includes unlimited native data connectors, and we don’t charge a premium for popular sources or by the source. Additionally, support is included for all plans—not just enterprise-level clients.
How to estimate rows...and your costs
So, rows by any other name...definitely aren't the same thing. And depending on your use case, one of these ways of handling rows may smell just a wee bit sweeter than the others.
Here's the TL;DR for how top ETL tools handle rows:
| Fivetran | Stitch | Panoply | |
| Name | Monthly active rows (MARs) | Replicated rows | Rows scanned |
| Definition | The number of distinct primary keys synced within a monthly period | New rows, updated rows (modified existing rows), sub-rows created from de-nesting & copied rows | The total number of rows successfully scanned from a data source |
| Update costs | You're charged once per row updated/added, with unlimited updates the a given billing period | [unknown] | Every time your data is synced |
| Nested data costs | [unknown] | Treated as additional rows | Subtables & nested data aren't counted in your total rows |
| Historical loads | Free during 2 week window for new data sources | Free during 1 week window for new data sources | Free during 2 week trial |
| Included data sources | Database connectors aren’t available for the Starter plan | 10 standard; premium sources cost extra | Unlimited native data sources |
Now that you have a basic understanding of rows and the market’s various pricing models, how can you decide which is the best fit for your use case?
The answer is simple: Take out a trial.
According to Stitch’s FAQ’s, “the best way to predict your data volume across all data sources is to connect all of your data sources during the free trial period, when you will be able to view a detailed breakdown of the volume of data being pushed by each data source.”
Likewise, here at Panoply, we offer a two week free trial so you can test the service and get a real-world estimate for usage. During the trial period, it’s important not to be thrown off by historical syncs—you’ll probably start by pulling in past data which can result in a ton of rows scanned, but that kind of loading is likely to be a rare occurrence.
Have more questions about rows, data sources, or storage and whether Panoply might be right for you? We’d love to help! Set up time with a Sales rep to learn more.


