Instagram is one of the world’s most used social networks and until recently, it’s been nearly impossible to discover insights hiding inside Instagram data sets. That’s exactly why we’ve built the Panoply Instagram Data Challenge!
Panoply is an all in one cloud data warehouse that lets data analysts, marketers and data-driven professionals, and anyone looking to use data connect, query and make discoveries in their data. With Instagram now as a new data source in Panoply, we’re excited to launch this competition for the world’s data sleuths and analysts. For the winning data submissions, we have prizes across three categories!
So get ready to team up, learn about Instagram data and bring your ideas to life!
TLDR (the short version):
In the month of April, we conducting an Instagram data challenge where you can analyze sample data sets, provide an insight and win great prizes. There are four steps to participation:
- Fill out the form on the right to get started. Provide your name and email address
- Start a Panoply trial (we will email it to you after you complete the form)
- Ingest our sample Instagram data or your own Instagram data
- Submit your insight or visualization entry on our Community by April 30, 2019 11:59 pm PST
Prizes will be awarded to the winner of these 3 categories: Most Beautiful Data Visualization; Most Impactful Data Insight; and People's Choice.
The Competition Fully Explained
Table of contents:
- Introduction: Show Us Your Data
- The Challenge and Prizes
- Requirements
- Step-by-step Instructions
- Support and Resources
- Meet The Judges
Show Us Your Data 💪!
Data hacking is all about examining a fun data set and building a beautiful visualization or unearthing an unknown insight. Your task for this data challenge is simple: Unleash your creativity!
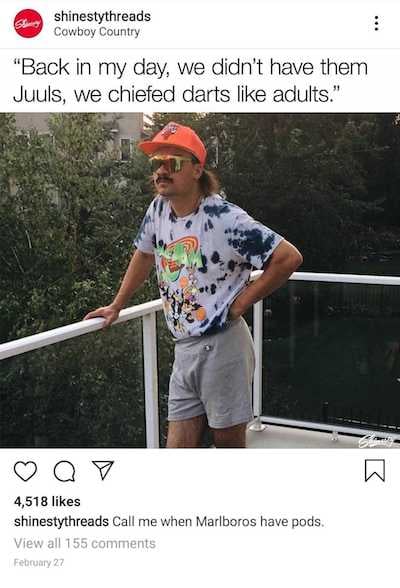
To get you started, we’ve assembled two sample Instagram data sets for analysis and disection, including a top Instagram Influencer, Kirsten Alana and an innovative and edgy apparel brand known as Shinesty.


For your data insight investigation, you can use your data tool of choice, including any SQL client or BI visualization tool.
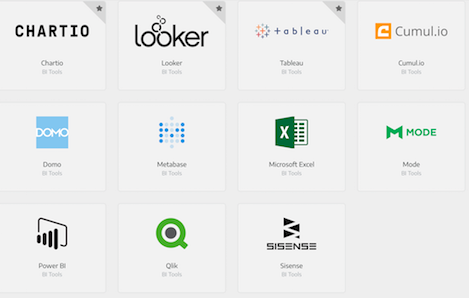
Need a suggestion on a data visualization tool or suite? We suggest using one of our partners.
Inspiration for the Challenge
There are many ways to explore Instagram data.
For example, you can examine Instagram post performance:
- Which kind of post performs best (video vs single image vs multiple images)
- What times of day drive comments/views
- The half-life of a post on Instagram
Post-specific questions such as:
- Which locations drive the most engagement?
- Does number of hashtags drive engagement?
- Which is the most-engaged-with IG follower?
The Challenge and the Prizes
There is a prize for each of the 3 categories detailed below.
Our prizes for each category will include a $1,000 USD Amazon.com gift card.
One prize will be awarded for submissions in each category
1. Most beautiful data visualization: Build the most beautiful visualization using Instagram Data. Use your favorite visualization tool to tell an amazing data story.
2. Most impactful data insight: Unearth the most interesting insight using Instagram Data. Uncover behavior patterns that no one could have expected.
3. Be voted 'People's Choice': Be voted 'People's Choice.' We'll be sharing all the submissions on social media for voting.
Requirements
- Submissions by individuals or teams must use an Instagram dataset, either our sample datasets or an Instagram dataset of your choosing
- Submissions must use Panoply as the data warehouse
- Participants can submit unique entries to each category (most beautiful visualization and most impactful insight)
- The People’s Choice category will be voted on by the public after the prior two categories are decided by our panel of judges
- The challenge is open to individuals in any country
- The final submissions needs to be in English
- Entry deadline is April 30, 2019 11:59 pm PST
- Panoply employees or dependents are welcome to submit an entry, but are not eligible for prizes
Step-by-step Instructions
- Fill out the form to the right and provide your name, email and company name (if applicable)
- Sign up for a free Panoply account
- Collect your Instagram data, either use the data from the Instagram account of your choosing or use either our sample Instagram data sets.
- If you choose to use the brand-focused Instagram data set from Shinesty, follow these directions:
- Once logged into Panoply, add a new data source
- Choose Amazon S3
- Enter the address: s3://panoply-instagram-challenge/ShinestyInstagram
- Select all files with "Shinesty" in the file name
- Add destination: ShinestyInstagram_{table_name}
- Click 'Advanced" and set the delimiter to other (radio button) and enter `|` (pipe) as the delimiter
- Press collect
- Enjoy your new data
- If you choose to use the Instagram Influencer-focused Instagram data set from Kirsten Alana, follow these directions:
- Once logged into Panoply, add a new data source
- Choose Amazon S3
- Enter the address: s3://panoply-instagram-challenge/KirstenAlanaInstagram
- Select all fileswith "Shinesty" in the file name
- Add destination: KirstenAlanaInstagram_{table_name}
- Click 'Advanced" and set the delimiter to other (radio button) and enter `|` (pipe) as the delimiter
- Press collect
- Enjoy your new data
- When you’re ready to submit your insight or visualization to our contest, do it on our Instagram Challenge category on our Community Forum. Note - all entries must include the SQL used in your query for verification and good karma/sharing reasons!
Support and Resources
- Read our Panoply documentation about the Instagram data source
- RSVP for our webinar on April 4th where we will:
- Discuss how to get started with Panoply
- Explore how to collect the sample Instagram data
- See how to collect your own Panoply data
- Connect a BI / visualization tool
Meet Our Judges
 Kate Strachnyi is the author of The Disruptors: Data Science Leaders and Journey to Data Scientist. Host of Datacated Weekly; a project dedicated to helping others learn about various topics in the data realm. Host of the Humans of Data Science (HoDS); uncovering the human side of data science. Extensive experience with data visualization tools (i.e. Tableau); proficient with gathering user requirements and developing custom interactive reports and dashboards using multiple data sources. Previously focused on risk management, governance, and regulatory response solutions for financial services institutions.
 Max Morganfeld came to data via digital marketing and the desire to provide clients with clear, actionble and dependable insights. For the last year, he's been helping digital agency Room 214 of Boulder, CO take their data and reports to the next level with Panoply. When he's not busy nerding out, he's trying to log off and get into the mountains of Colorado
 Kirsten Alana is a freelance photographer who has worked in more than 50 countries on six continents for some of the most awarded campaigns in digital and social media. Her portfolio of clients has included brands in travel, fashion and lifestyle ranging from Four Seasons and SPG to Ted Baker and Amarula and her work has been featured in print magazines in the USA, Europe and Australia. Her expertise in mobile photography, photography and social media has led her to speak at conferences around the globe. She resides in Los Angeles when she is not traveling on assignment.
 Kristen Kehrer is the founder of Data Moves Me, LLC and a data scientist who has been delivering innovative and actionable machine learning solutions industry for the last 9 years. Kristen was #8 LinkedIn Top Voice in Data Science and Analytics. She holds an MS in Applied Statistics and a BS in Mathematics.
 Betsy is the Senior Manager of BI & Analytics at Spanx, in Atlanta. She has spent the last two decades leading Data Warehousing and Business Intelligence teams in both the retail and financial industries. Betsy can translate business vision and requirements into data stories that move the needle (or help find the needle in a haystack) for teams across organizations. Betsy is excited to be a part of this challenge!
Start exploring Instagram data!
Thanks for joining the challenge; time to create a data warehouse! A confirmation email has been sent to you.
Panoply is used by some of the world’s most data-driven companies.


